
Small Caps Had a Great First Half
Key Takeaways
- Small Caps outperformed large caps by 12.3% in the first half of 2026.
- Despite this rally, small caps still trail by 19.6% on a trailing three-year basis.
- A strong six months isn’t a sign to overhaul your portfolio; it’s a reason to stay diversified.
Back in March, we wrote about something that we hadn’t seen in years (March Blog). Small-cap (companies with a market cap between $300M and $2B) were starting to close the gap on their large-cap (companies with a market cap greater than $10B) counterparts. It was early. A couple of strong months, but no clear signs. We said it was worth keeping an eye on, but not overhauling your entire portfolio.
As we hit the halfway mark in the year, it’s a good time for a check-in. Not guessing or forecasting what will happen, just a look at what has recently happened, measured against what we thought might happen.
“Time is your friend; impulse is your enemy” – John C. Bogle
The Numbers Are In and Loud
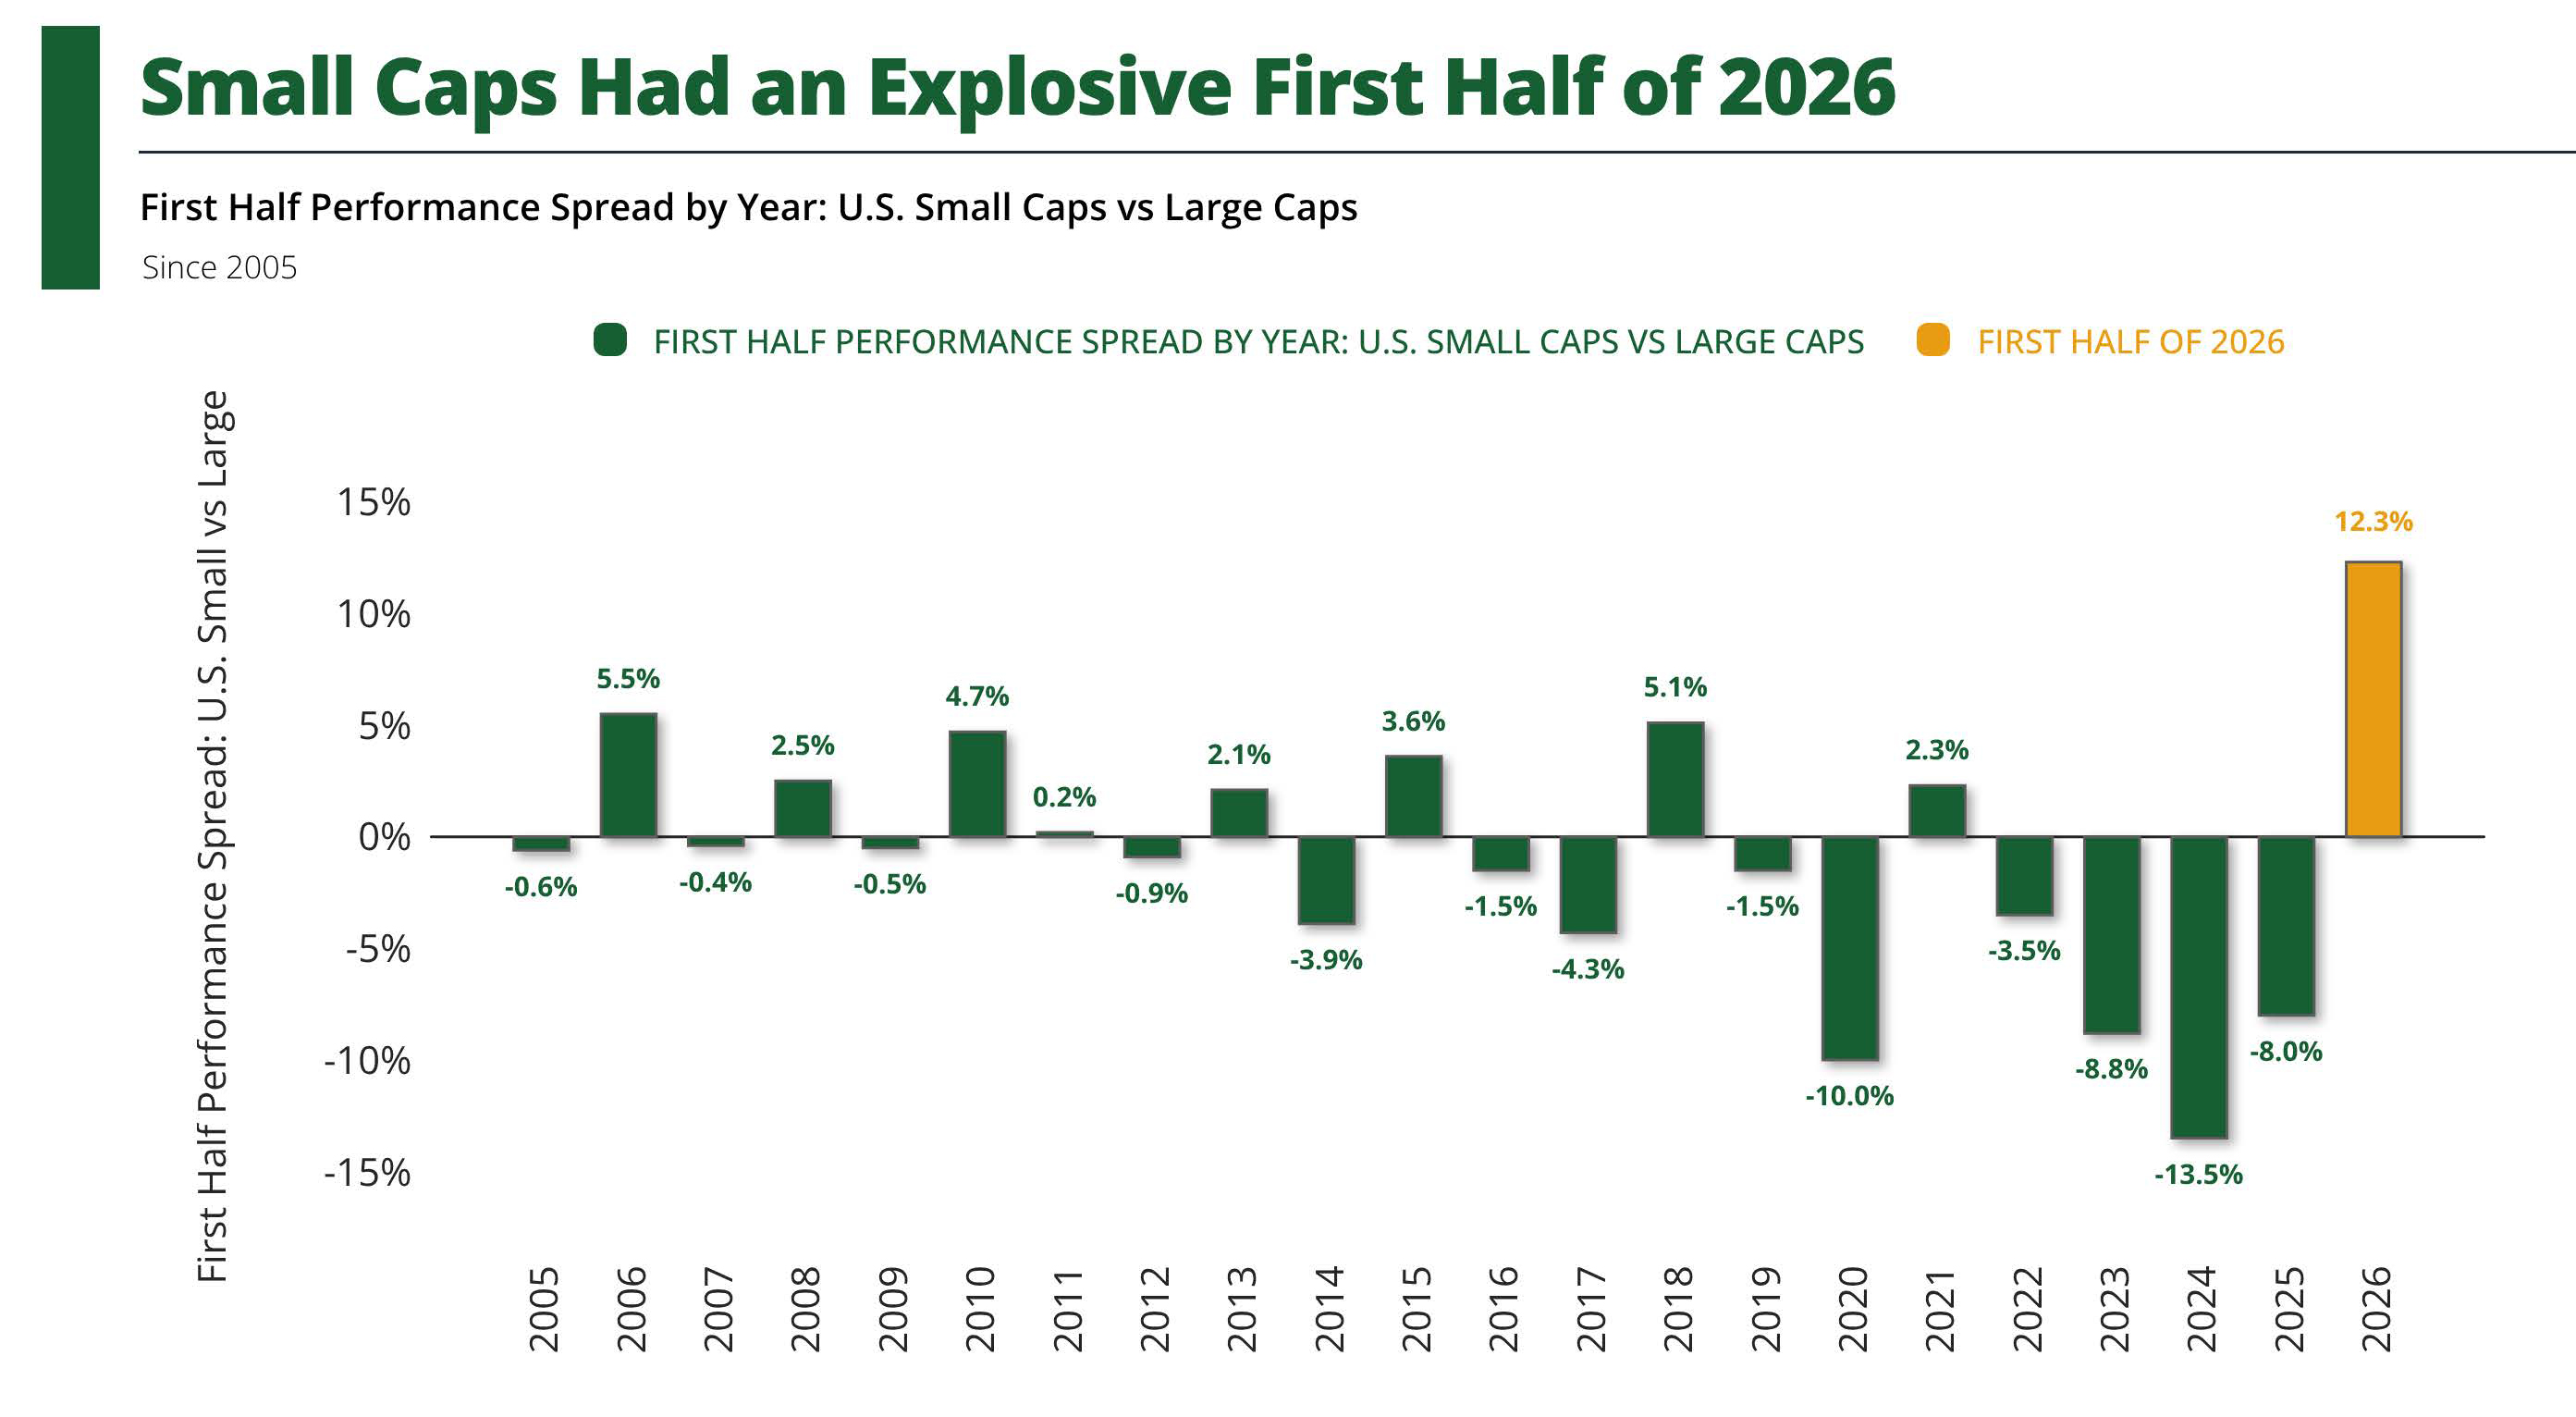
Source: Exhibit A, FactSet Research Systems Inc.; Standard & Poor's. Data as of June 30, 2026. Methodology: Performance spread reflects the difference between the total returns of the iShares Russell 2000 ETF (IWM) and the SPDR S&P 500 ETF (SPY) from December 31 through June 30 of each year shown. Total returns assume reinvested dividends. Past performance is not indicative of future results. ETFs are unmanaged, do not reflect the deduction of advisory fees, transaction costs, or taxes, and cannot be invested in directly.
Take a quick look at the chart above. Does anything stand out? Since 2005, the first half spread between small caps and large caps has stayed within a pretty tight window. A good year, small caps outperform by four or five percent. A bad one, they underperform by about the same. Even the best years over the past two decades look minimal compared to what just happened.
Throughout the first half of 2026, small caps outperformed large caps by 12.3%. That’s not a typo. Nothing else on the chart comes close. It’s more than double the best first half in the past two decades, and it comes after three rough ones: -3.5% in 2022, -8.8% in 2023, and -13.5% in 2024. This is one of the biggest swings in the spread since 2005.
Did Our Thesis Hold?
In March, we pointed out three things that were working to support the small-cap thesis: rate cuts to ease the burden of debt, an attractive valuation gap, and a heavier reliance on domestic revenue, helping insulate global trade noise. The first of these didn’t play out. The Fed held rates steady for the first half, and expectations for rate cuts got pushed further out rather than pulled forward. But the valuation gap and domestic revenue advantage held. Small caps put up their best first half in decades with a missing leg. That’s worth thinking about.
The answer is yes, the thesis held. BUT here’s where a mid-year check-in earns its name: confirming what happened isn’t the same as knowing what’s next. A runner who makes up significant ground in the first half of a race hasn’t won anything. They’ve simply shown they belong.
One Good Half Isn’t the Race
“You shouldn’t make the assumption that today’s leaders are certain
to be the leaders of tomorrow” — Howard Marks
Here’s the lesson we tried to leave you with in March, and it still stands: A strong run is not an invitation to chase it.
Take another look at the chart above. The prior first halves were rough for small caps, the worst three-year stretch in the whole data set. Anyone who decided to bail on small caps during this time would’ve missed this year’s comeback completely. That’s the trap that a single data point, no matter how impressive, can set. The exact reason we always repeat the importance of staying diversified across company sizes is so that we don’t have to guess which will take the lead next.
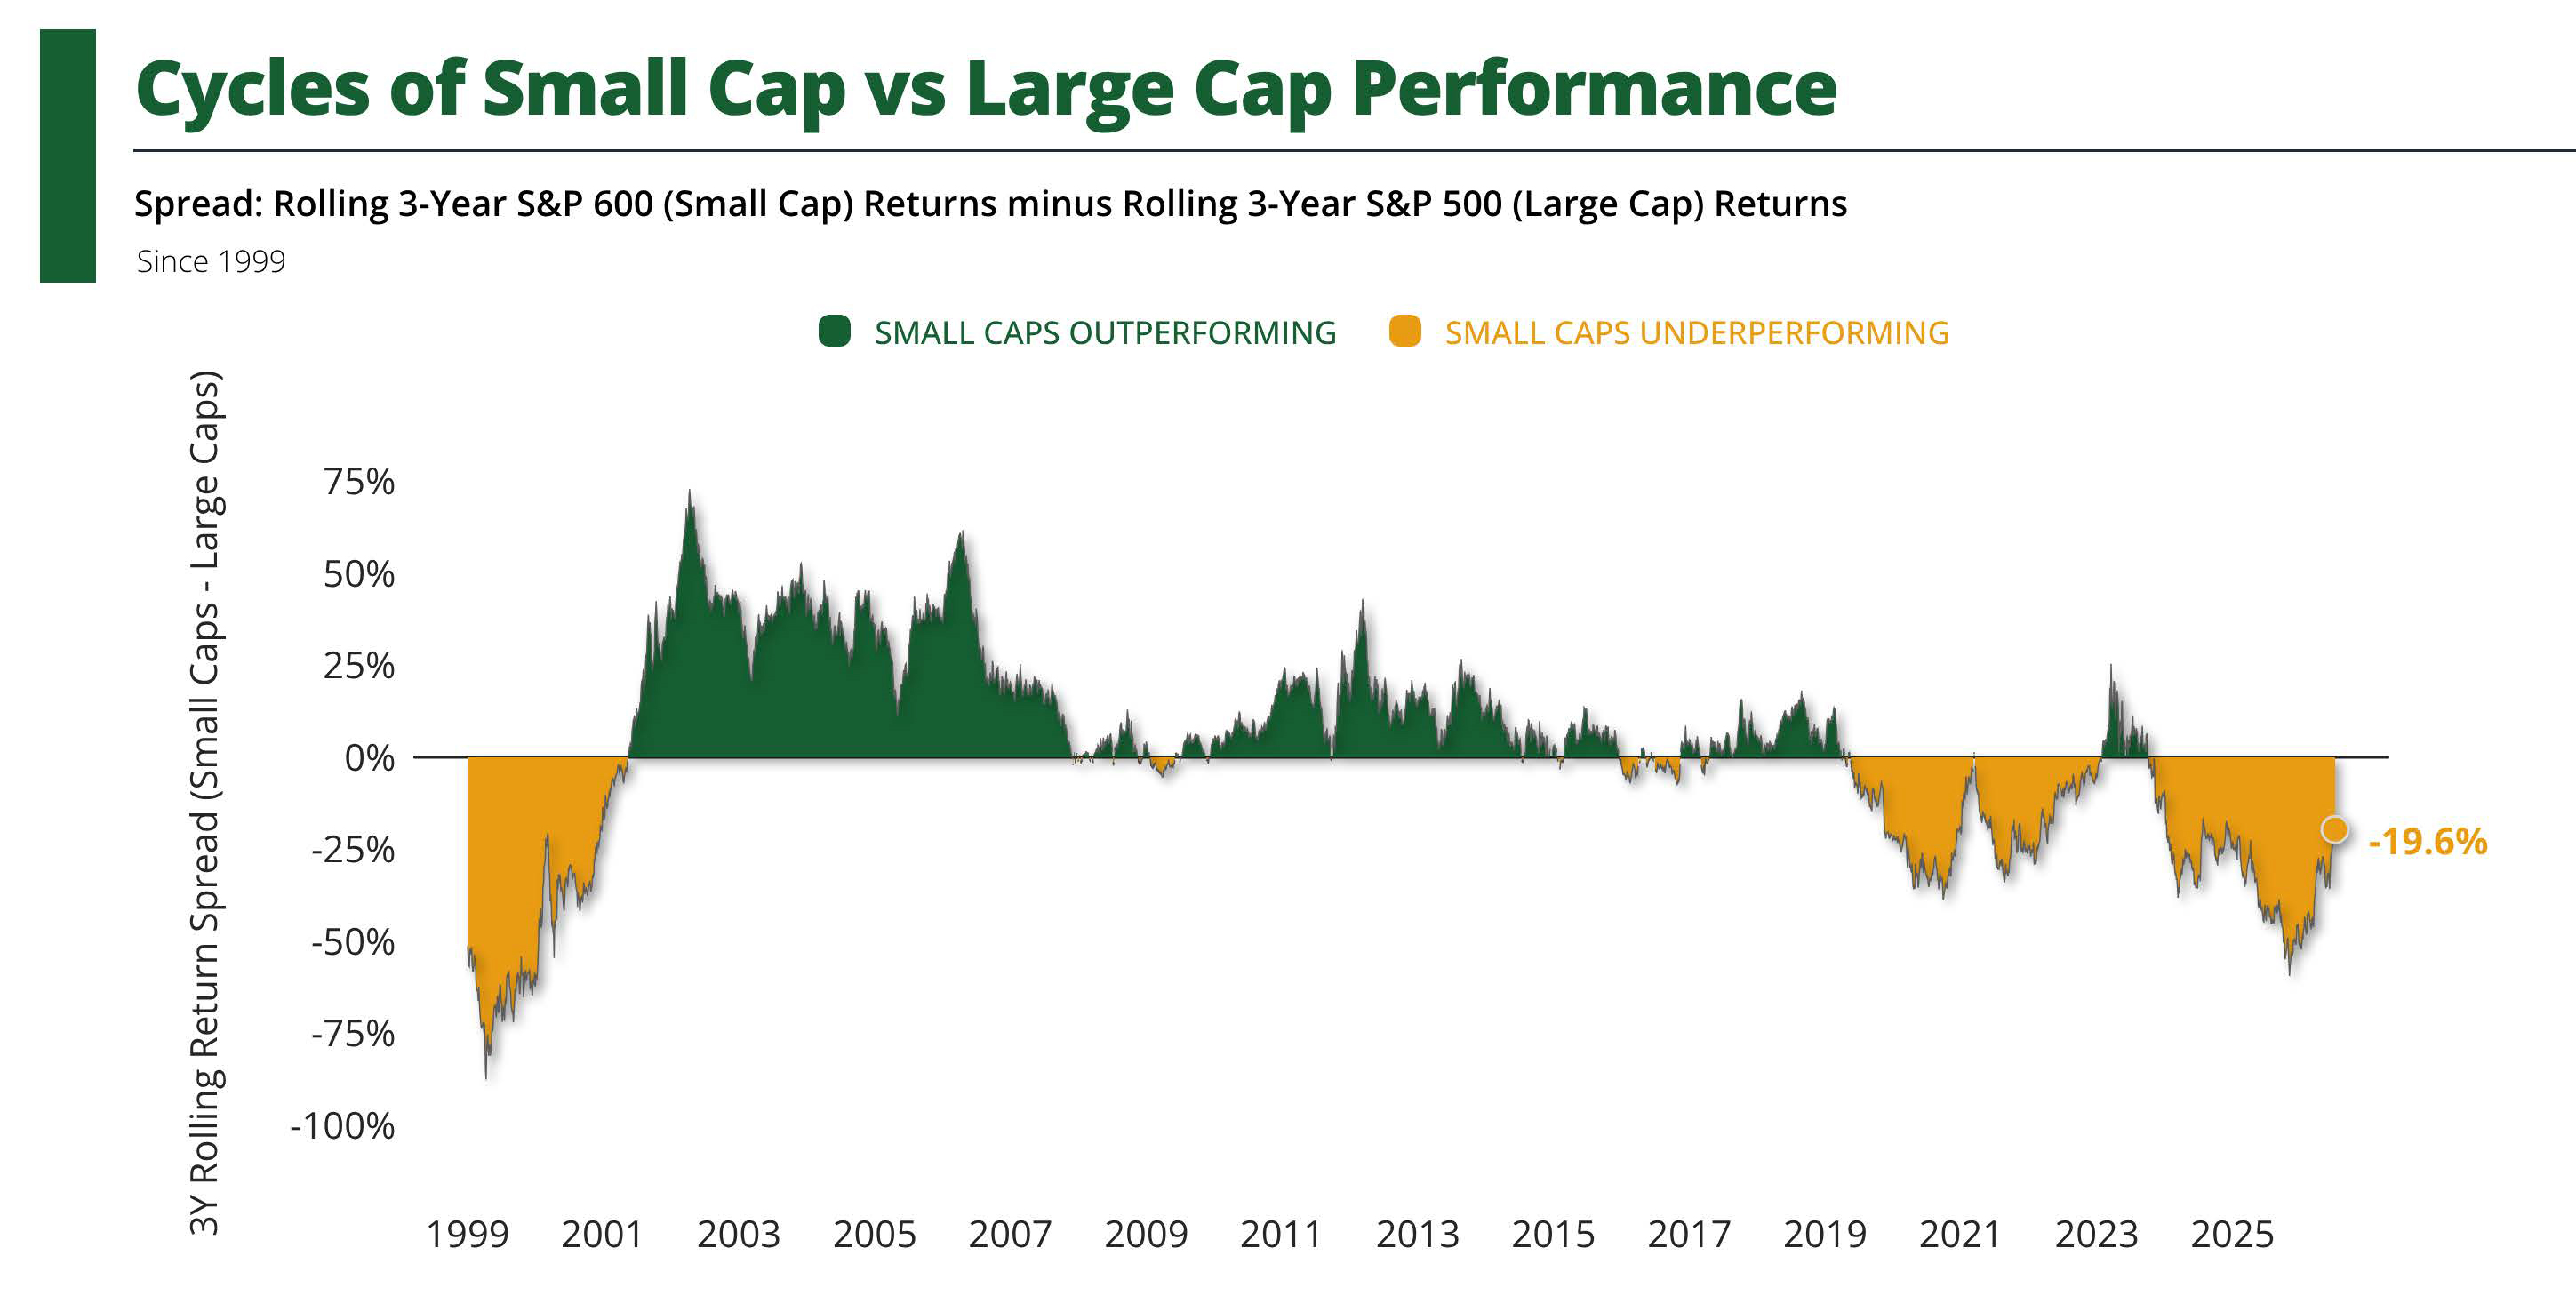
Source: Exhibit A, FactSet Research Systems Inc.; Standard & Poor's. Data as of July 5, 2026. Methodology: Chart shows the rolling three-year return spread between the S&P 600 Index and the S&P 500 Index. Past performance is not indicative of future results. Indices are unmanaged, do not reflect the deduction of advisory fees, transaction costs, or taxes, and cannot be invested in directly.
Zoom out and be humbled. Chart 1 covers the first 6 months of every year, dating back to 2005. This chart above covers rolling three-year returns back to 1999 and tells a not-so-good story. Even after the best first half in decades, small-cap stocks still trail large-cap stocks by 19.6% over the trailing three years. One good half didn’t close a multi-year gap; it barely even made a dent.
I’m not telling anyone to pile into small-cap stocks because the rally will continue. I’m also not telling anyone to bail completely because “they already had their run.” Both of these reactions come from the same place: recency bias. Responding to what has recently happened instead of sticking with a plan that was built for longevity. If your portfolio already holds a mix of company sizes, this year is exactly why it exists. You didn’t need to call this rally. Just needed to be positioned well enough to benefit from it.
Small caps had a great first half. Best in decades. However, history reminds us that market leadership rarely stays consistent. Leaders become laggards just as fast as laggards can become leaders. That’s the whole game of investing, and it’s why nobody should be rewriting their entire portfolio based on six good months. It’s also why diversification should remain a core part of your investment strategy, rather than chasing whatever is having its moment in the sun.
If you’d like to talk through how this shift affects your portfolio, or whether your current mix still fits your goals, reach out. We’re always glad to have that conversation.
~ Ricardo Salinas
Certain statements contained herein reflect current expectations or opinions and are subject to change without notice. Actual market or economic conditions may differ from those discussed.
Market and index data are based on information believed to be reliable as of July 2026, but accuracy and completeness cannot be guaranteed. The S&P 500 Index measures the performance of large-cap U.S. stocks, and the S&P 600 Index measures the performance of small-cap U.S. stocks. Indices are unmanaged and cannot be invested in directly.
Past performance is not indicative of future results. Investing involves risk, including the possible loss of principal. Diversification and asset allocation do not ensure a profit or protect against loss in declining markets. Small-cap investing involves additional risks, including greater volatility, lower liquidity, and increased sensitivity to economic conditions than large-cap stocks.