
Why this Matters to You
Elections create uncertainty and short-term volatility, but historically they haven't determined long-term market performance. We stay focused on the fundamental factors that drive long-term market returns, including earnings growth, and keep your portfolio aligned with your plan.
The Chicago Daily Tribune's November 3rd, 1948 edition carried the most famous mistake in American journalism. DEWEY DEFEATS TRUMAN ran across the top of the front page. A printers' strike had forced an early deadline, and the paper's Washington correspondent had called the race a safe bet. Life magazine was already on newsstands with a photograph of Thomas Dewey captioned “The Next President of the United States.” More than 100,000 copies went out before a second edition caught the error. The next day, Harry Truman stood on the rear platform of his train at Union Station in St. Louis, held the paper up over his head, and grinned.
Seventy-eight years later to the day, Americans vote in the midterm elections. We start with that photograph because this is a quarter in which you'll hear a great many confident predictions, and it's worth remembering how those have gone.
The question we care about is what a midterm election changes for the companies you own. We'll take it in three steps: what's actually on the ballot in November, what divided government has historically meant for businesses, and what has mattered more than any of it over the decades your financial plan actually spans.
Midterms Have Been Hard on the President’s Party Since 1946
On November 3rd, all 435 House seats, 35 regularly scheduled Senate seats, two additional Senate special elections, and more than 30 governorships are on the ballot.
Since 1946 there have been twenty midterms. The President's party lost House seats in eighteen of them, and the average change across all twenty was a loss of 25 seats. Chart 1 shows every one of these elections. The pattern is well established: the President's party has historically lost House seats in midterm elections.
The Midterm Pattern Is Old and Consistent
Net House Seats Gained or Lost by the President’s Party in Each Midterm Election 1946 to 2022
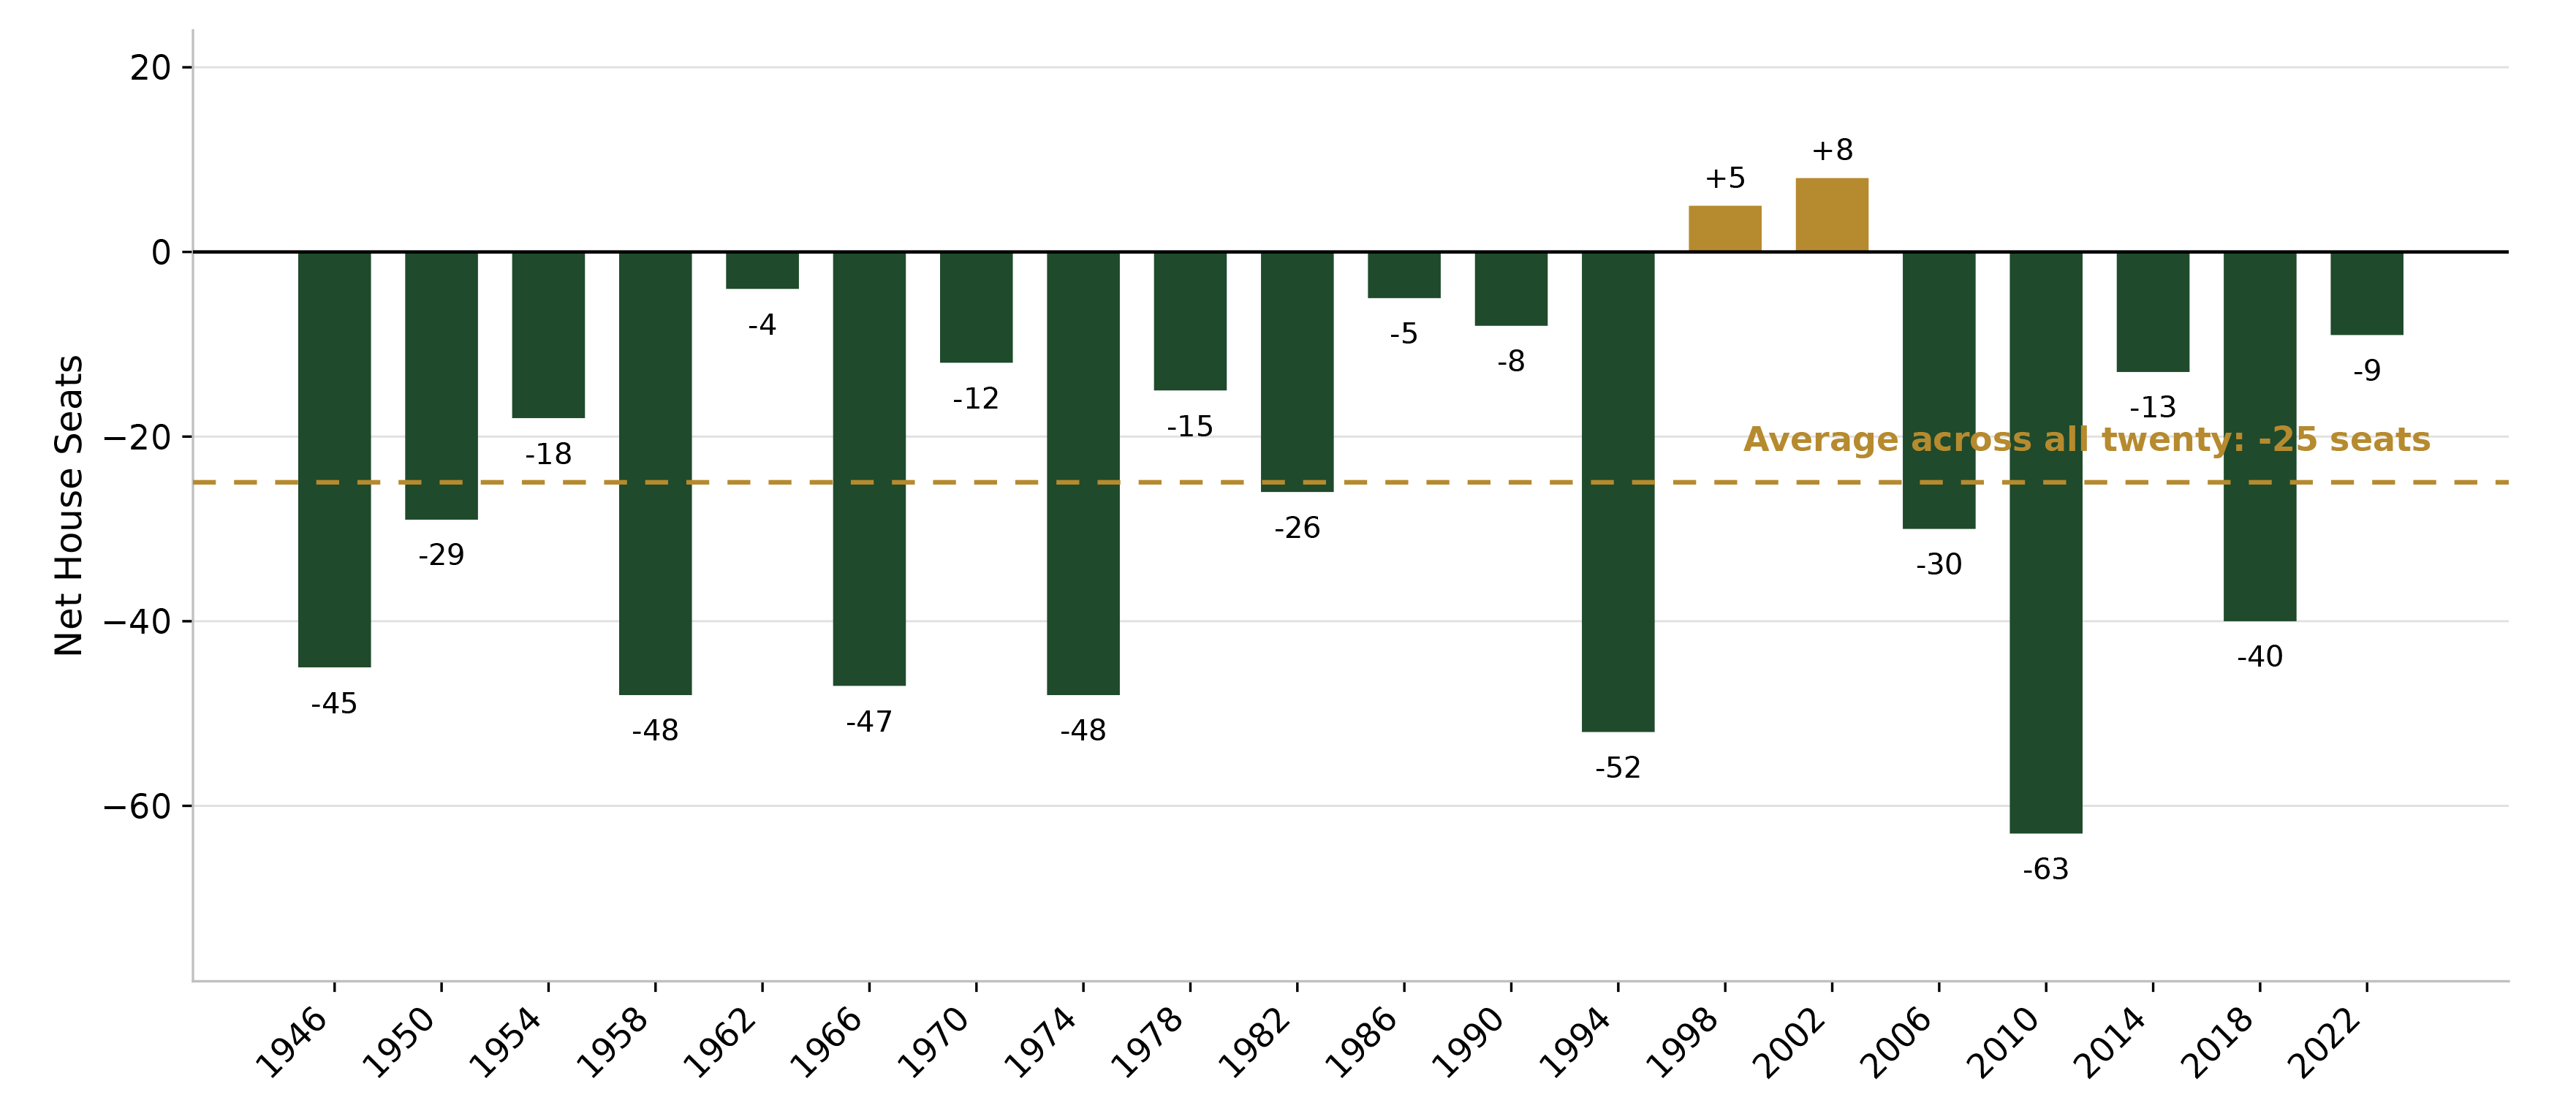
CHART ONE: Source: The American Presidency Project, “Seats in Congress Gained/Lost by the President’s Party in Mid-Term Elections” (Peters and Woolley, UC Santa Barbara), compiled from U.S. House of Representatives, Office of the Historian, “Party Divisions of the House of Representatives, 1789 to Present.” Chart by KWB Wealth.
Gridlock Narrows the Range of Policy Outcomes Companies Face
LPL Research's Midyear Outlook 2026 carries a split Congress as its base case and describes what that generally produces: fewer large legislative changes and more volatility around government funding and the debt ceiling. That's a fair summary of the trade. You get less lawmaking and more brinkmanship.
Businesses tend to like the first half of that trade because it makes the future more predictable, and predictability is the raw material of a corporate budget.
Consider what a company is doing when it decides whether to build a plant, hire 400 people, or sign a five-year supply contract. It's pricing a range of possible futures. If the tax code, the tariff schedule, and the regulatory regime could all move sharply in either direction, that range is wide, and management tends to wait. A divided government can narrow that range. Sweeping legislative change may become less likely in either direction, potentially giving businesses greater visibility as they make longer-term capital decisions.
Midterm Years Have Been the Weakest of the Cycle. The Year After Has Been the Strongest.
Since 1950, the second year of a presidential term has been the weakest of the four, averaging a 4.7% full-year return, and it has carried the deepest average intra-year drawdown of the cycle at 17.5%. Chart 2 shows how that compares with the rest of the cycle. Longtime readers will recognize the point from our first-quarter newsletter, where we flagged midterm volatility as the most likely source of turbulence in 2026.
Elevated Volatility Is Historically Normal in Midterm Years
S&P 500 Average Intra-Year Drawdown vs. Average Full Year Return Across the Four Year Presidential Cycle Since 1950
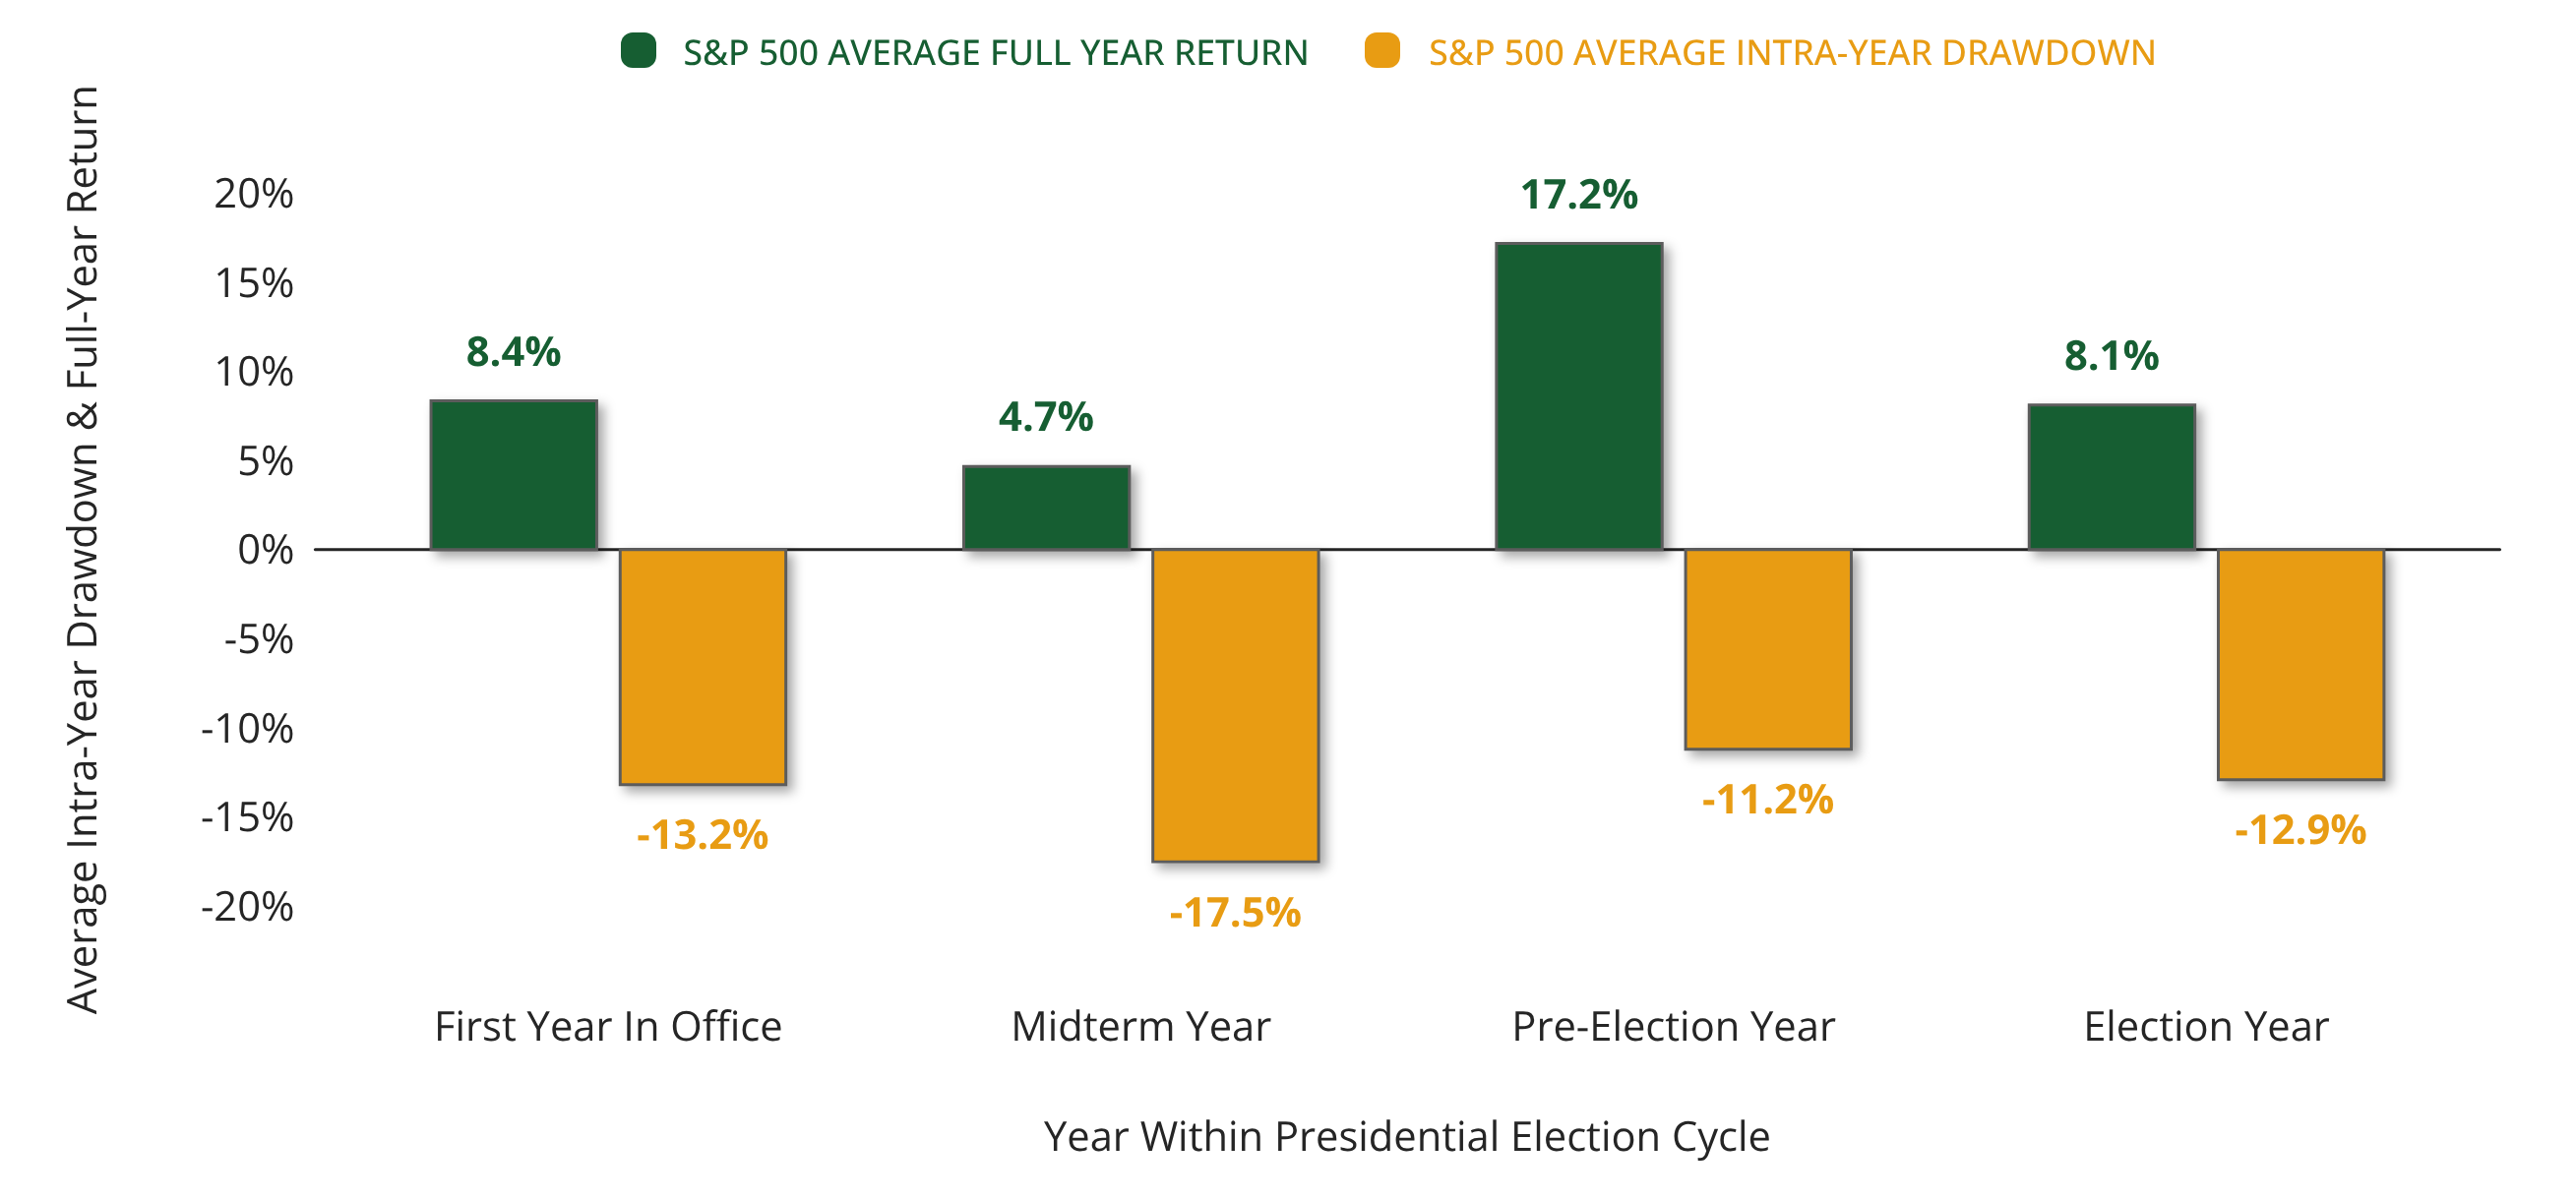
CHART TWO: Source: © Exhibit A, FactSet Research Systems Inc., Standard & Poor’s | Latest: 2025-12-31
This year hasn't read from that script. Through mid-September the S&P 500 was up 11.7% with dividends reinvested, and that comes on top of 26% in 2023, 25% in 2024, and 18% in 2025. Counting from the end of 2022, the index has roughly doubled.
Strong midterm year or weak one, what follows has been the most reliable stretch of the cycle. The pre-presidential election[RB1] [SG2] [RB3] year, meaning the twelve months after the midterms, has averaged 17.2%, the best of the four. LPL Research puts a finer point on it: going back to 1954, the S&P 500 has been higher twelve months after every single midterm election, eighteen for eighteen. That record covers every result the country has handed Washington in those seventy years, including sweeps by both parties, split Congresses, incumbents routed, and incumbents holding on. As LPL's Jeff Buchbinder describes it, uncertainty tends to peak ahead of the vote and starts fading once the outcome is known, which lets investors go back to paying attention to growth, earnings, and the Federal Reserve.
A word of caution. Those pre-presidential election averages were mostly set following ordinary or weak midterm years, which isn't the setup in front of us. Coming off a near doubling in under four years, it's fair to wonder whether some of the return the pattern would anticipate is already sitting in prices. Eighteen observations is a small sample regardless, and a streak that has held eighteen times can break on the nineteenth. Knowing that the twelve months after an election have historically been good also tells you nothing useful about the twelve weeks before one. If September and October are choppy, that would be the most ordinary thing in the world for a midterm year.
Earnings, Not Election Results, Have Driven Long-Term Returns
If you're 62 today and planning for a thirty-year retirement, your money has to work through fifteen more Congresses. Any single one represents only a small portion of that time horizon.
Chart 3 is the one we'd put on the wall. It plots the S&P 500 since 1950, shaded by which party held the White House. The line climbs through fourteen presidents of both parties, and you can't pick out the party changes from its shape. Whatever has driven that climb, it doesn't line up with which party held office.
Ignoring Politics When Investing
S&P 500 Price Under Democrats and Republicans Since 1950
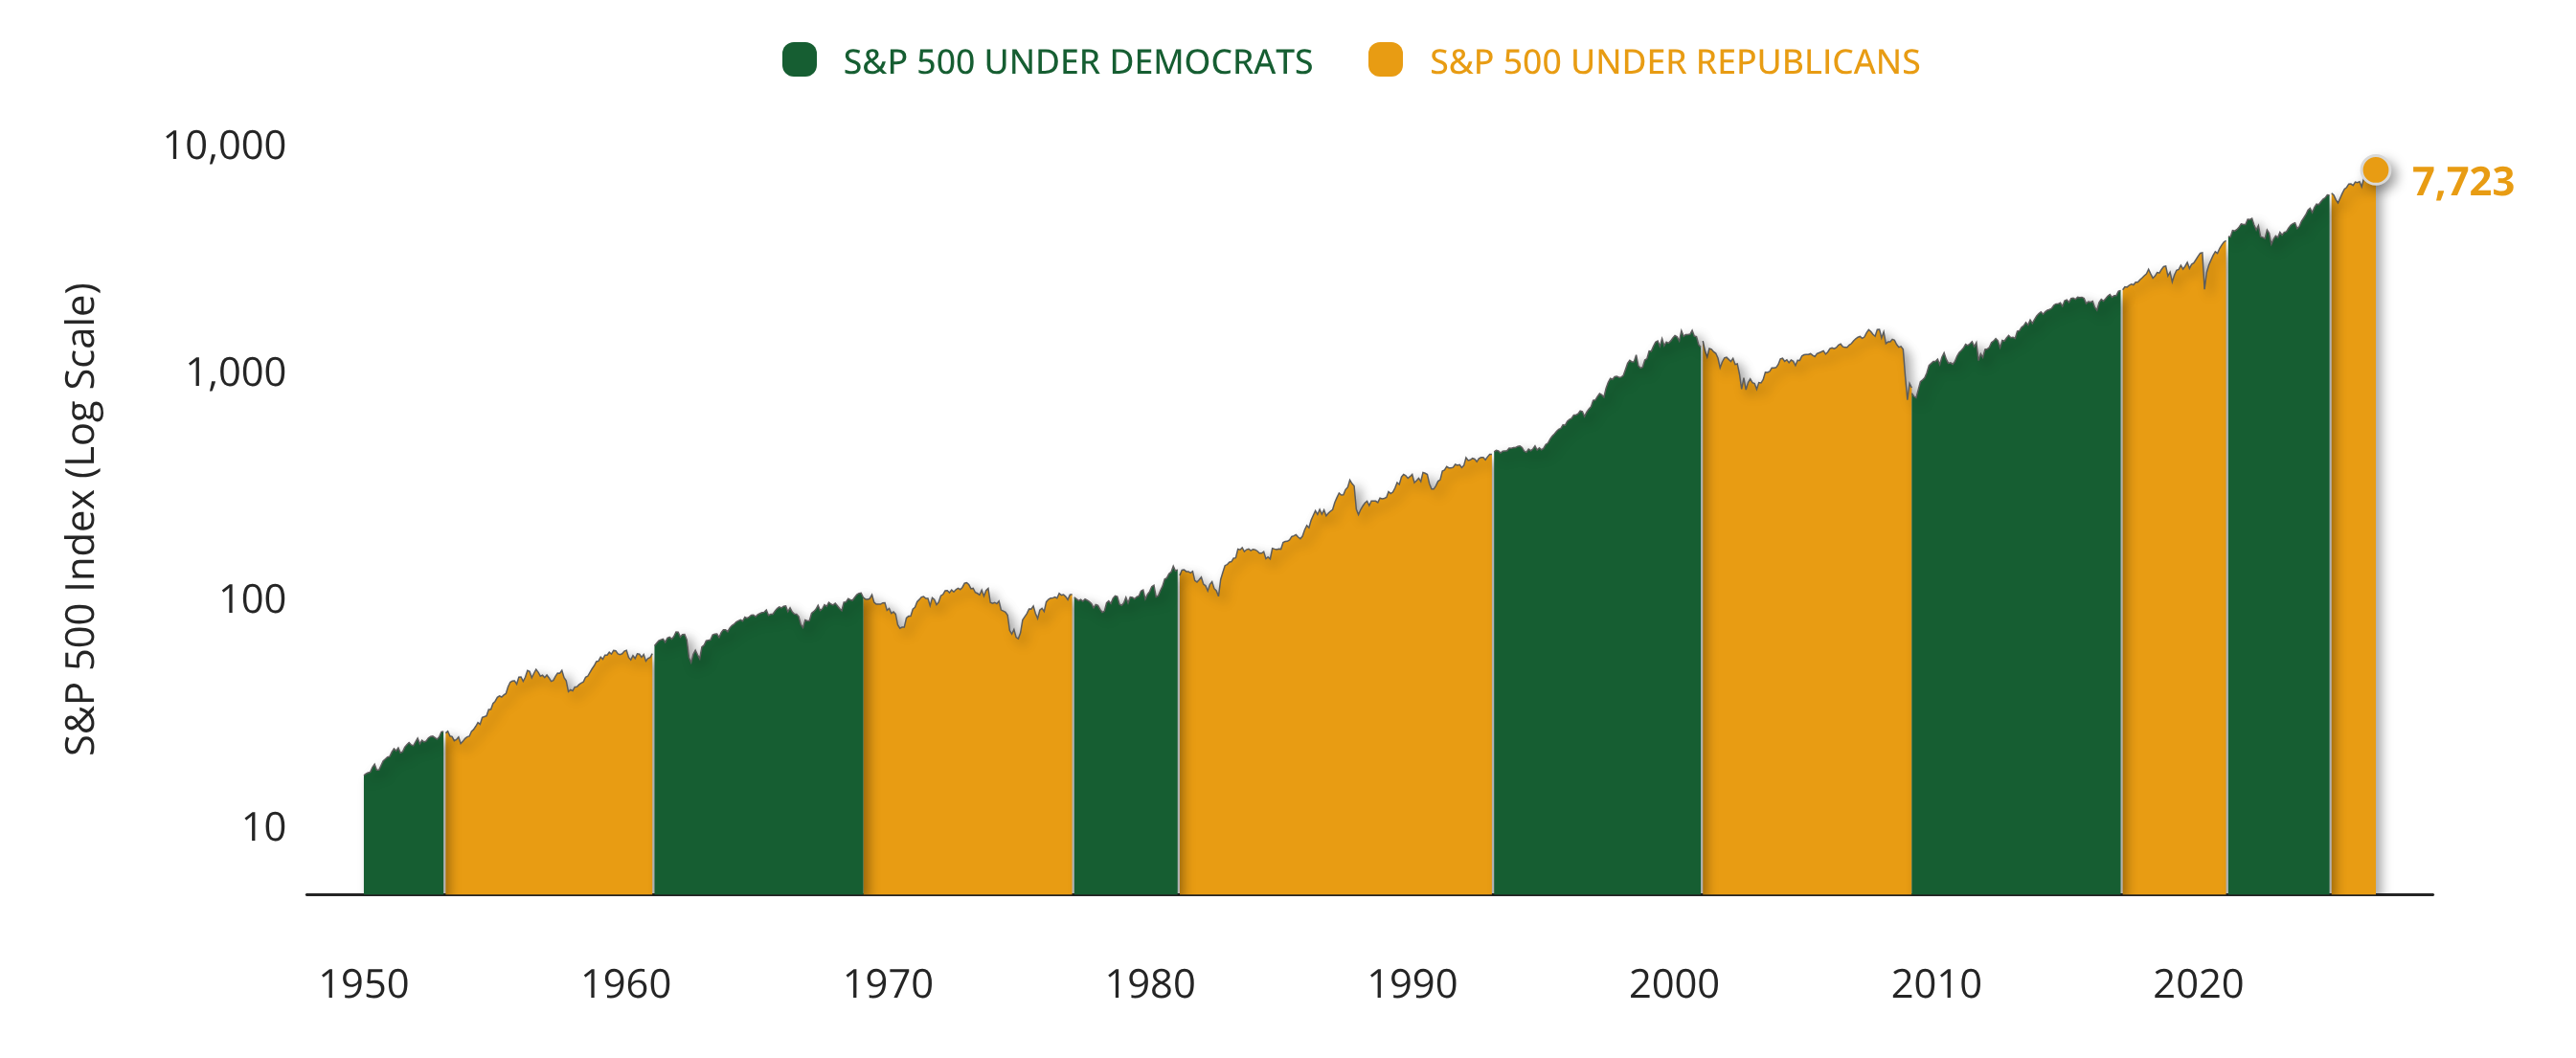
CHART THREE: Source: © Exhibit A, FactSet Research Systems Inc., Standard & Poor’s | Latest: 2026-10-04
What drove it is earnings. Chart 4 breaks down the S&P 500's year-to-date total return into its components. Earnings growth has contributed 25.79% and dividends another 1.00%, while the price-to-earnings multiple, meaning what investors will pay for a dollar of earnings, has subtracted 12.98%. Earnings and dividends together more than offset that decline, and investors are paying less per dollar of earnings today than they were in January.
Where are Equity Returns Coming from in 2026
S&P 500 YTD Total Return Broken Down by Contribution from Earnings, P/E Multiple, and Dividends Year-to-Date 2026
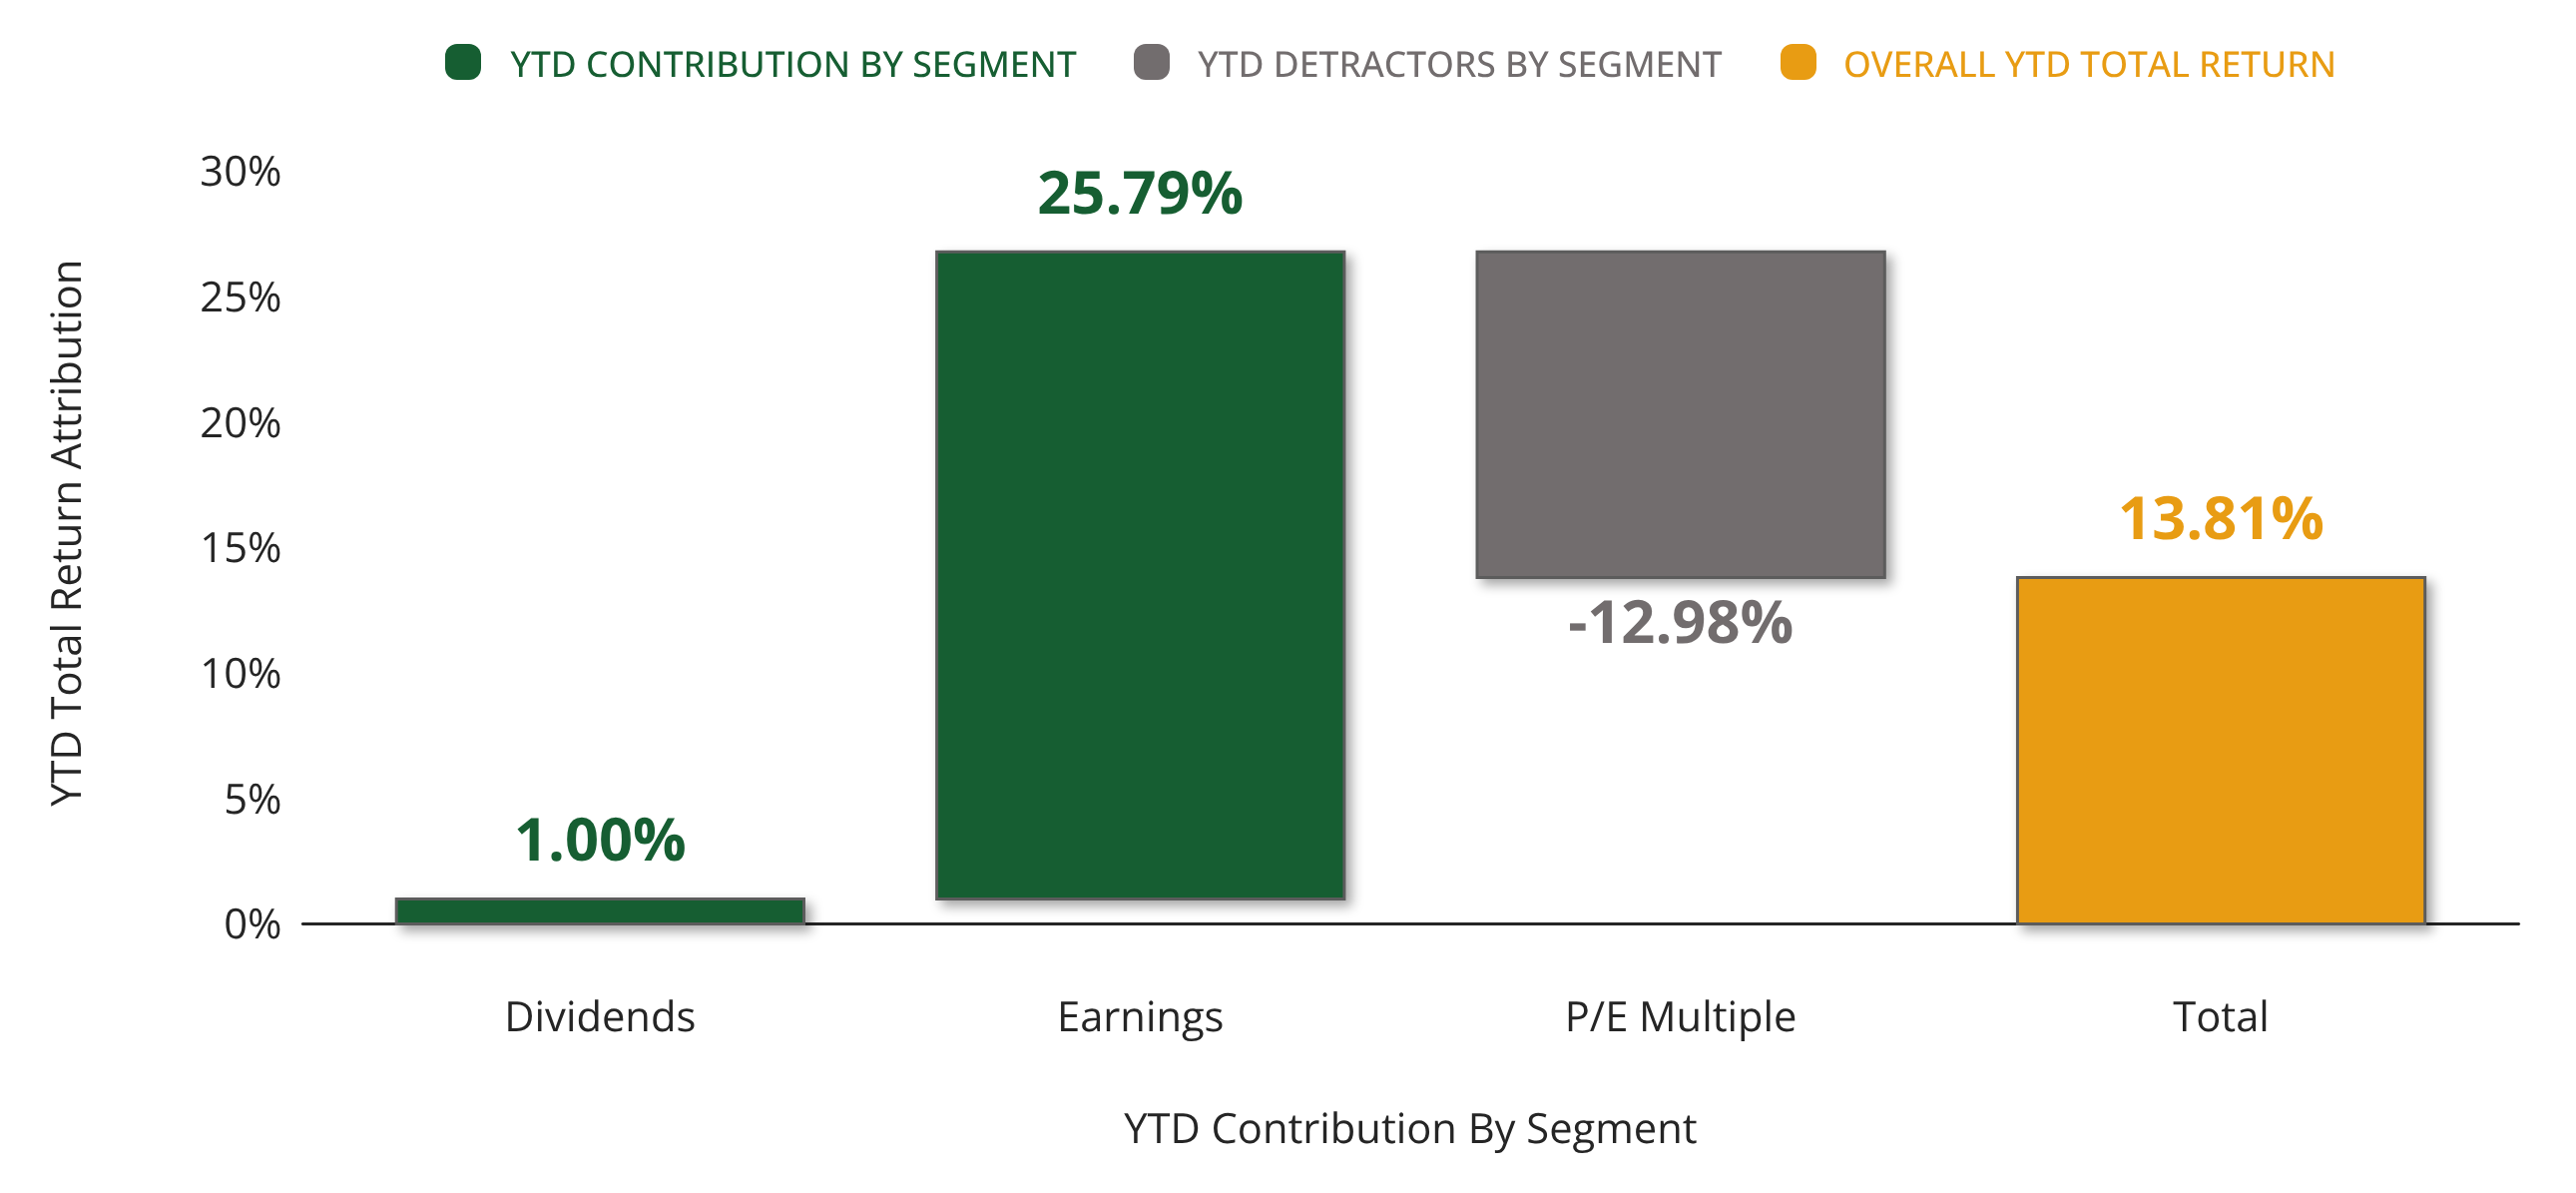
CHART FOUR: Source: © Exhibit A, FactSet Research Systems Inc., Standard & Poor’s | Latest: 2026-10-02
That bears on the earlier caution about returns being pulled forward. Gains driven by multiple expansion depend on investors continuing to pay up, and they can stop. In our view, earnings growth provides a more fundamental source of support for market gains than multiple expansion alone. Over long stretches, what a company is worth has been determined mostly by what it earns.
Policy does touch those earnings. Tax rates, tariffs, and regulations are real, and they land unevenly across industries. What they haven't done is interrupt the underlying pattern: companies innovate, compete, and grow their earnings over time, and they've done it through every Congress since 1950.
That history is why an election doesn't change how we manage portfolios. We monitor them continuously and make changes when conditions warrant them. Positioning remains diversified in line with the objectives and risk tolerance you and your Wealth Manager set together, and we rebalance as allocations drift.
Where the election could reasonably matter is in your own plan rather than in the market. A business sale, a Roth conversion schedule, or a concentrated position in an industry facing regulatory change are all worth talking through. We can model how each one looks against your plan and provide guidance on potential strategies based on your individual circumstances. However, it’s better to discuss that with us before November, rather than after.
If you have any questions or your financial situation has changed (beneficiaries, income needs, investment objectives, time horizon, risk tolerance, etc.), don’t hesitate to contact our office. Thank you for your continued trust in KWB Wealth.
The opinions expressed are for general informational purposes only and are not intended as individualized investment, tax, or legal advice. KWB Wealth and LPL Financial do not provide tax or legal advice. Please consult the appropriate professional regarding your individual circumstances.
Historical market and election-cycle data is provided for illustrative purposes only and is not predictive of future results. Past performance is no guarantee of future results. References to political parties, election outcomes, or policy matters are for informational purposes only and do not constitute an endorsement of any candidate, party, or political position.
The S&P 500 is an unmanaged index and cannot be invested in directly. Index performance does not reflect advisory fees, transaction costs, or taxes. Investing involves risk, including possible loss of principal. Diversification and asset allocation do not guarantee a profit or protect against loss.
Certain information and data are derived from third-party sources believed to be reliable, including LPL Research; however, their accuracy or completeness cannot be guaranteed. LPL Financial is the broker-dealer with which KWB Wealth's representatives are registered.
The representatives of KWB Wealth are registered representatives with, and securities are offered through LPL Financial, Member FINRA/SIPC. Investment advice offered through KWB Wealth, an SEC registered investment adviser and separate entity from LPL Financial.
KWB Wealth is an SEC registered investment adviser. This material is solely for informational purposes. Advisory services are only offered to clients or prospective clients where KWB and its representatives are properly licensed or exempt from licensure. Past performance is no guarantee of future returns. Investing involves risk and possible loss of principal capital. No advice may be rendered by KWB unless a client service agreement is in place.