
As spring arrives and we settle into a new quarter, we want to take a moment to thank you for the trust you place in KWB Wealth. Our goal with each newsletter is to cut through the noise, put current events in their proper historical context, and remind you of the principles that have guided successful investors through every kind of market environment. This quarter, there’s quite a bit of noise to cut through.
There’s no point beating around the bush. On February 28th, it was reported that U.S. and Israeli forces initiated strikes against Iranian military, missile, and leadership infrastructure, resulting in the death of Iranian Supreme Leader Ayatollah Ali Khamenei. Since then, markets and, in particular, oil prices have been unsettled by a wave of uncertainty that has understandably left many investors wondering what comes next.
I want to be clear about one thing upfront: I’m not going to offer any opinion on the geopolitical decisions that led to this moment. Military operations involve an immense amount of intelligence and context that no financial advisor, journalist, or commentator possesses in full. What I can do is offer you something arguably more useful right now: a historical perspective. Because if there’s one thing decades of market data teach us, it’s that the world has been here before, and investors who stayed the course were almost always glad they did.
S&P 500 After Major Geopolitical Events
S&P 500 1-Year Forward Returns (%) After Major Geopolitical Events
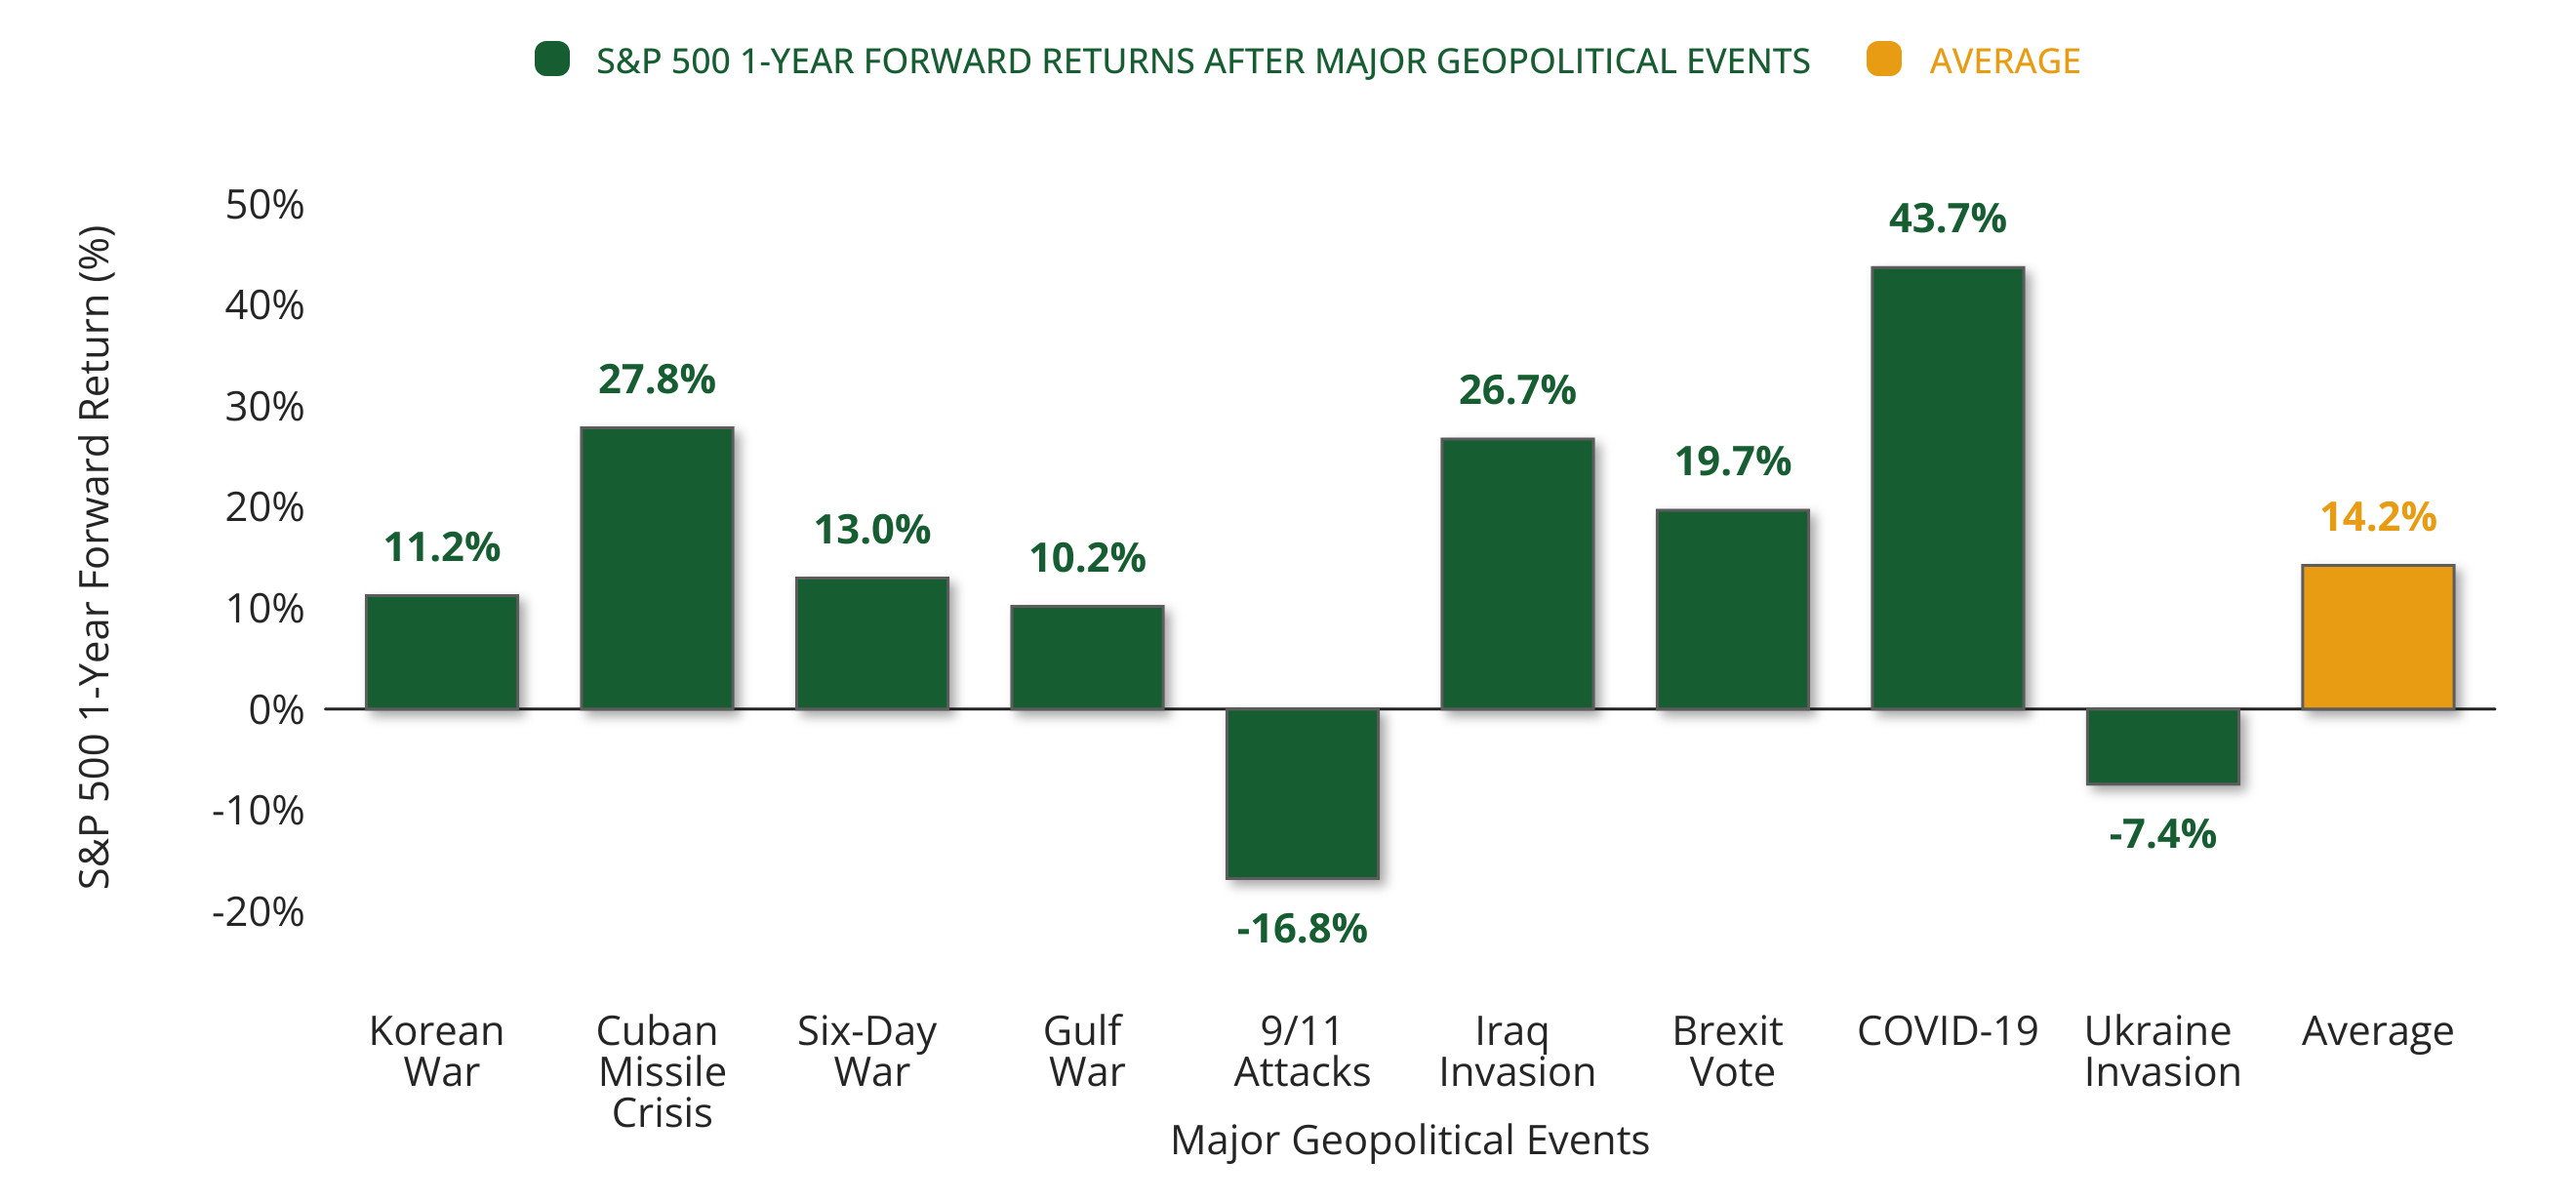
CHART ONE: Source: © Exhibit A, FactSet Research Systems Inc., Standard & Poor's | Latest: 2026-03-16
Since the Korean War, markets have weathered an extraordinary parade of global crises: the Cuban Missile Crisis, Vietnam, the Gulf War, 9/11, the Iraq War, Russia’s invasion of Ukraine, and more. And yet, as Chart 1 illustrates, since the Korean War (1950-present), the S&P 500 has averaged a 14.2% gain in the year following a major geopolitical event. The only exceptions were 9/11, which struck during the recession that followed the dot-com collapse, and Russia’s invasion of Ukraine, which preceded the inflation surge that weighed on markets throughout 2022. The pattern is remarkably consistent: when the economy and stock market are healthy going into a crisis, they tend to come out the other side healthy as well. Geopolitical shocks are real, but they are rarely the story that defines your long-term returns.
Historically, What Happens to Stocks After a Surge in Oil?
S&P 500 1-Year Forward Return Following 2-Day Oil Surges of 20%+
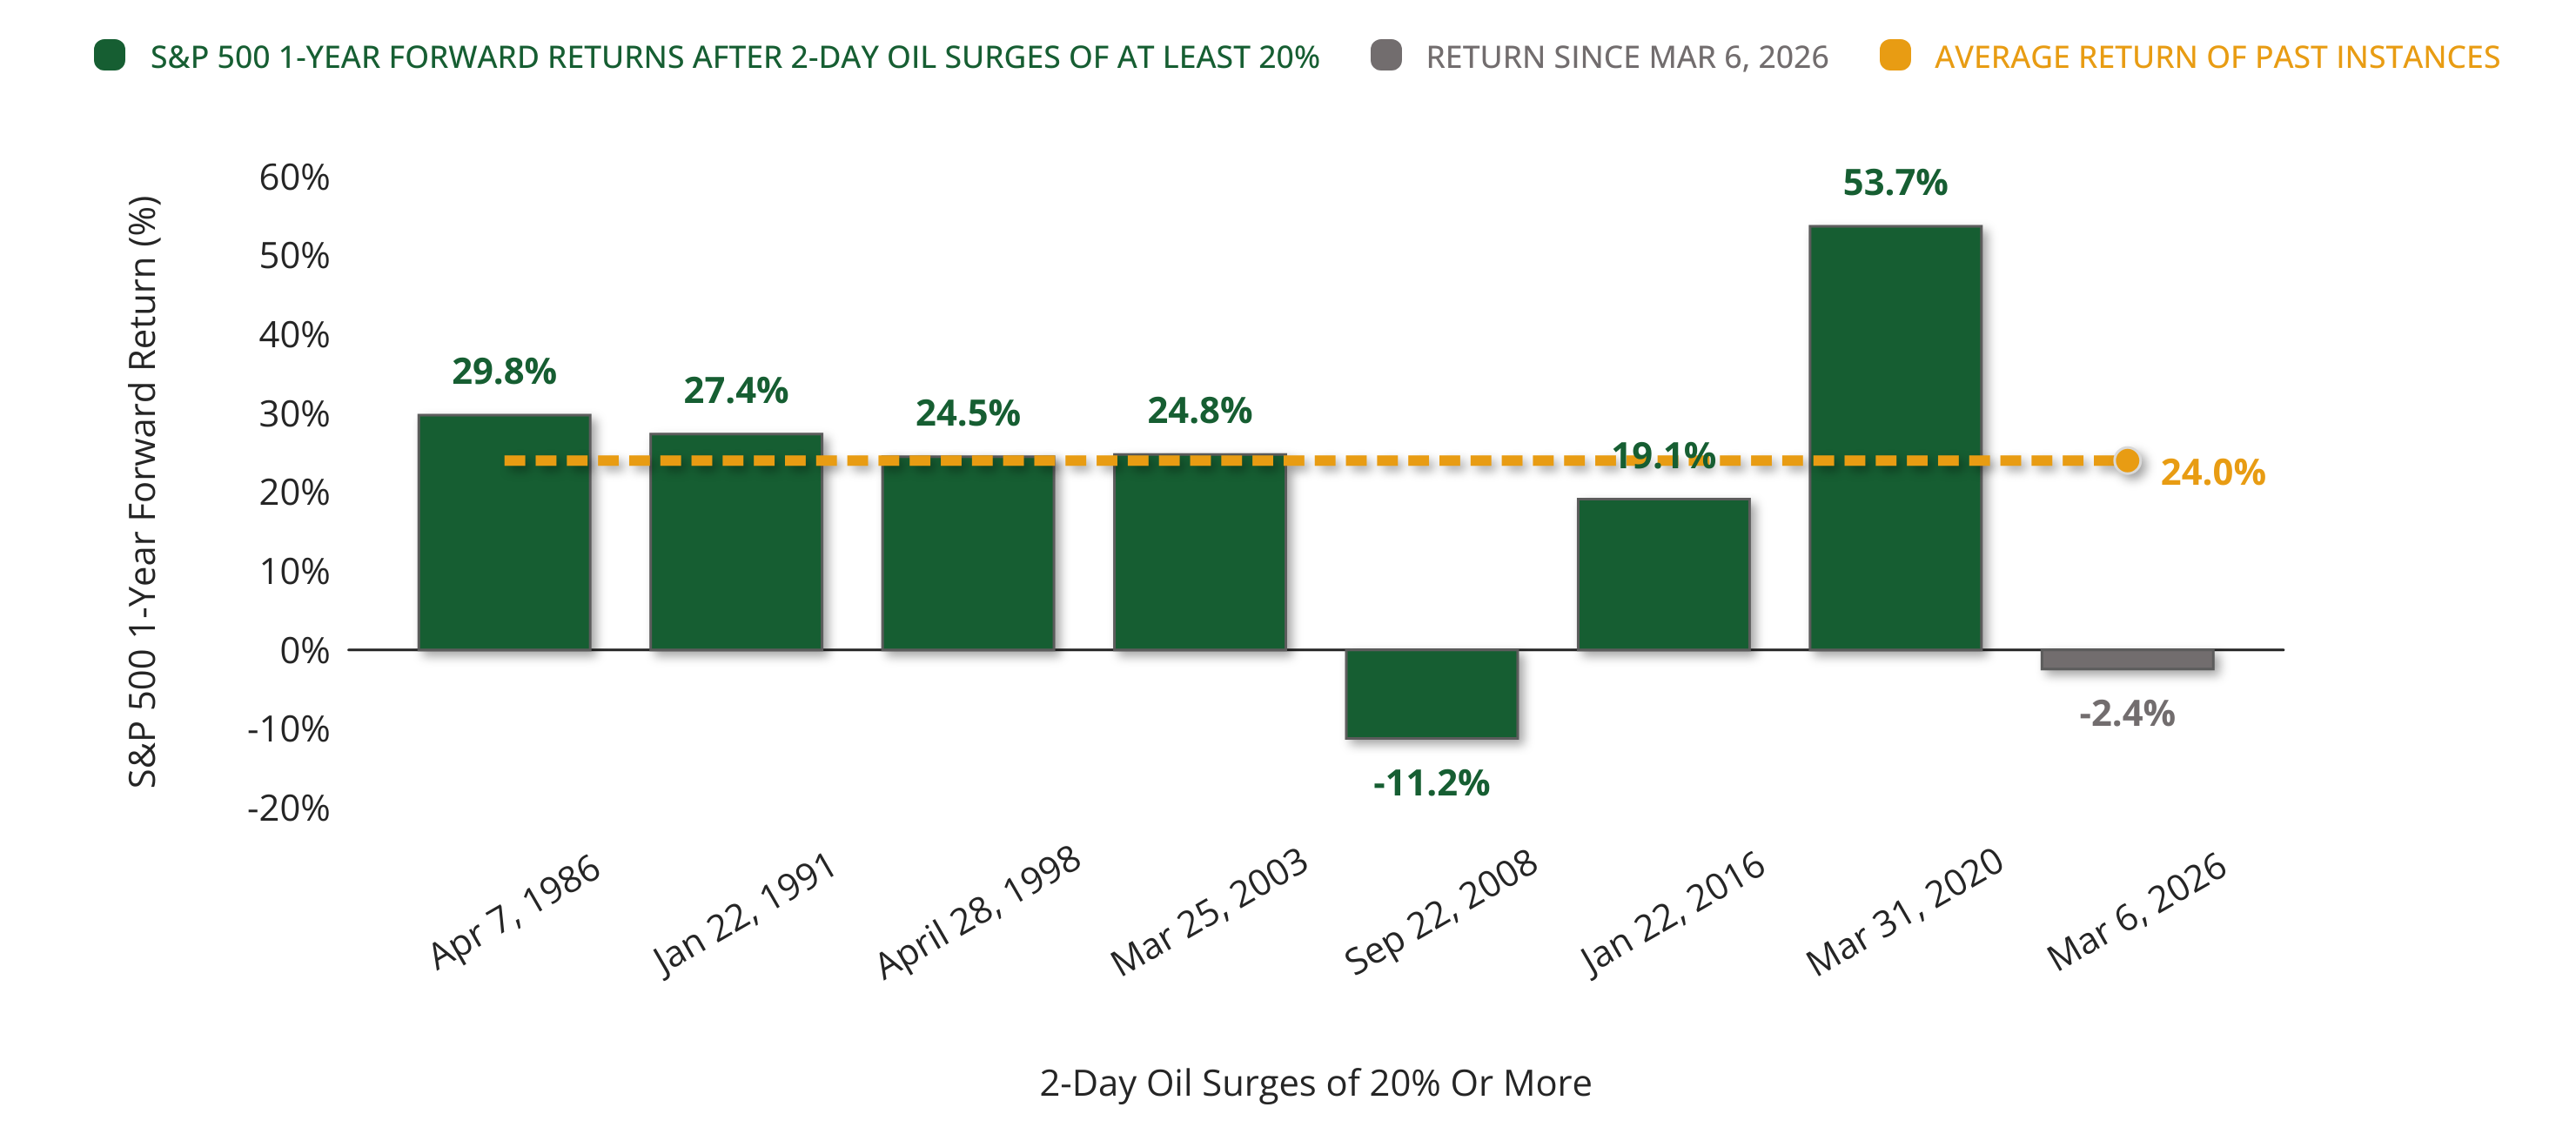
CHART TWO: Source: © Exhibit A, FactSet Research Systems Inc., Standard & Poor's | Latest: 2026-04-01
The most immediate and tangible consequence of this conflict for most Americans has been the closure of the Strait of Hormuz and the resulting spike in oil prices, something you’ve felt every time you’ve pulled up to a gas pump in recent weeks. So, what does history tell us about sudden, sharp jumps in oil prices and how markets respond? The answer is surprisingly reassuring. Chart 2 shows that following a two-day surge in oil prices of more than 20%, the S&P 500 has historically gained an average of 24% over the following year. The lone exception was during the recession that followed the Great Financial Crisis of 2008, a market that was already severely wounded before oil ever entered the equation. Different chart, same story: a strong economy tends to absorb shocks and keep moving forward.
If history is so encouraging, why have markets been choppy since February 28th? I think the answer comes down to one of my most firmly held beliefs about investing: Don’t Fight the Fed. With oil prices surging and inflation risks rising, the Federal Reserve now has less room to maneuver. At the start of 2026, prediction markets were pricing in two rate cuts for the year. Today, they’re pricing in none, and in certain scenarios, the Fed could consider rate increases if inflation takes hold. Moving from a Fed that wanted to ease conditions to one that may need to tighten them is a meaningful shift, and markets are adjusting to that new reality in real time. How it all resolves, I genuinely don’t know. But I know what the right response is for long-term investors, and it’s the same answer it always is: diversification.
Asset Class Returns In 2026
Year-to-date (YTD) Returns Of Various Asset Classes in 2026
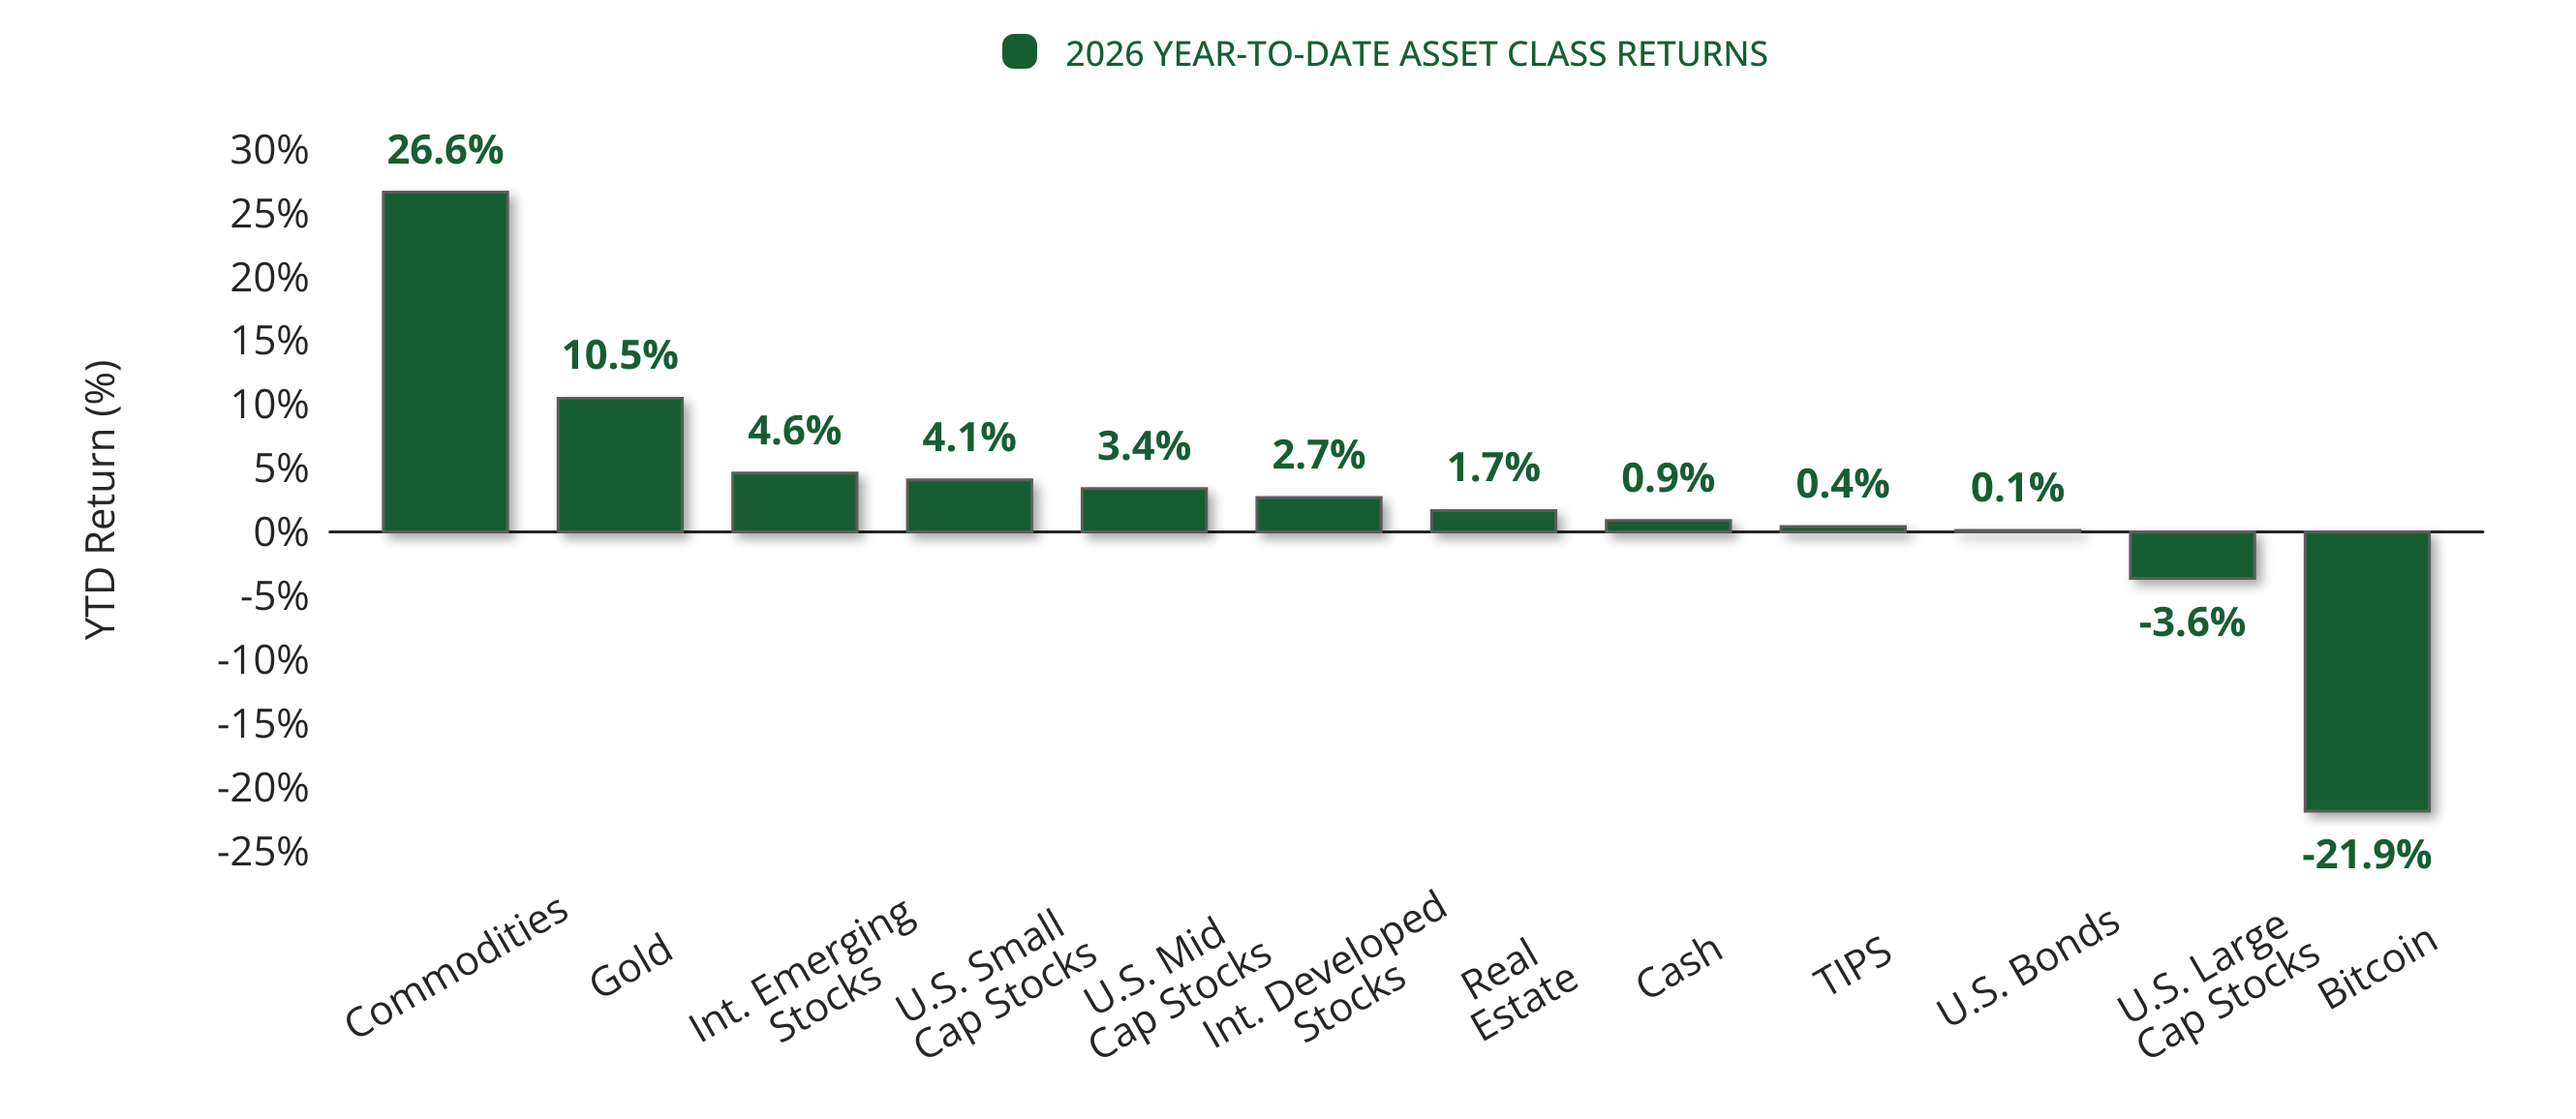
CHART THREE: Source: © Exhibit A, FactSet Research Systems Inc., Standard & Poor's | Latest: 2026-04-01
Chart 3 tells a story worth pausing on. While U.S. large-cap stocks are down year-to-date, every other major asset class (except Bitcoin, which is not included in our model portfolios) is higher for the year. International equities, bonds, and real assets: they’ve all been doing their job. Just as we saw in 2025, diversification is working in 2026. Not because it’s magic, but because it’s math. When one part of the market struggles, other parts often hold firm or even thrive, smoothing out the ride and keeping your overall portfolio moving in the right direction.
The Hidden Volatility Behind the Magnificent 7
Max Drawdowns for the Magnificent 7 Stocks
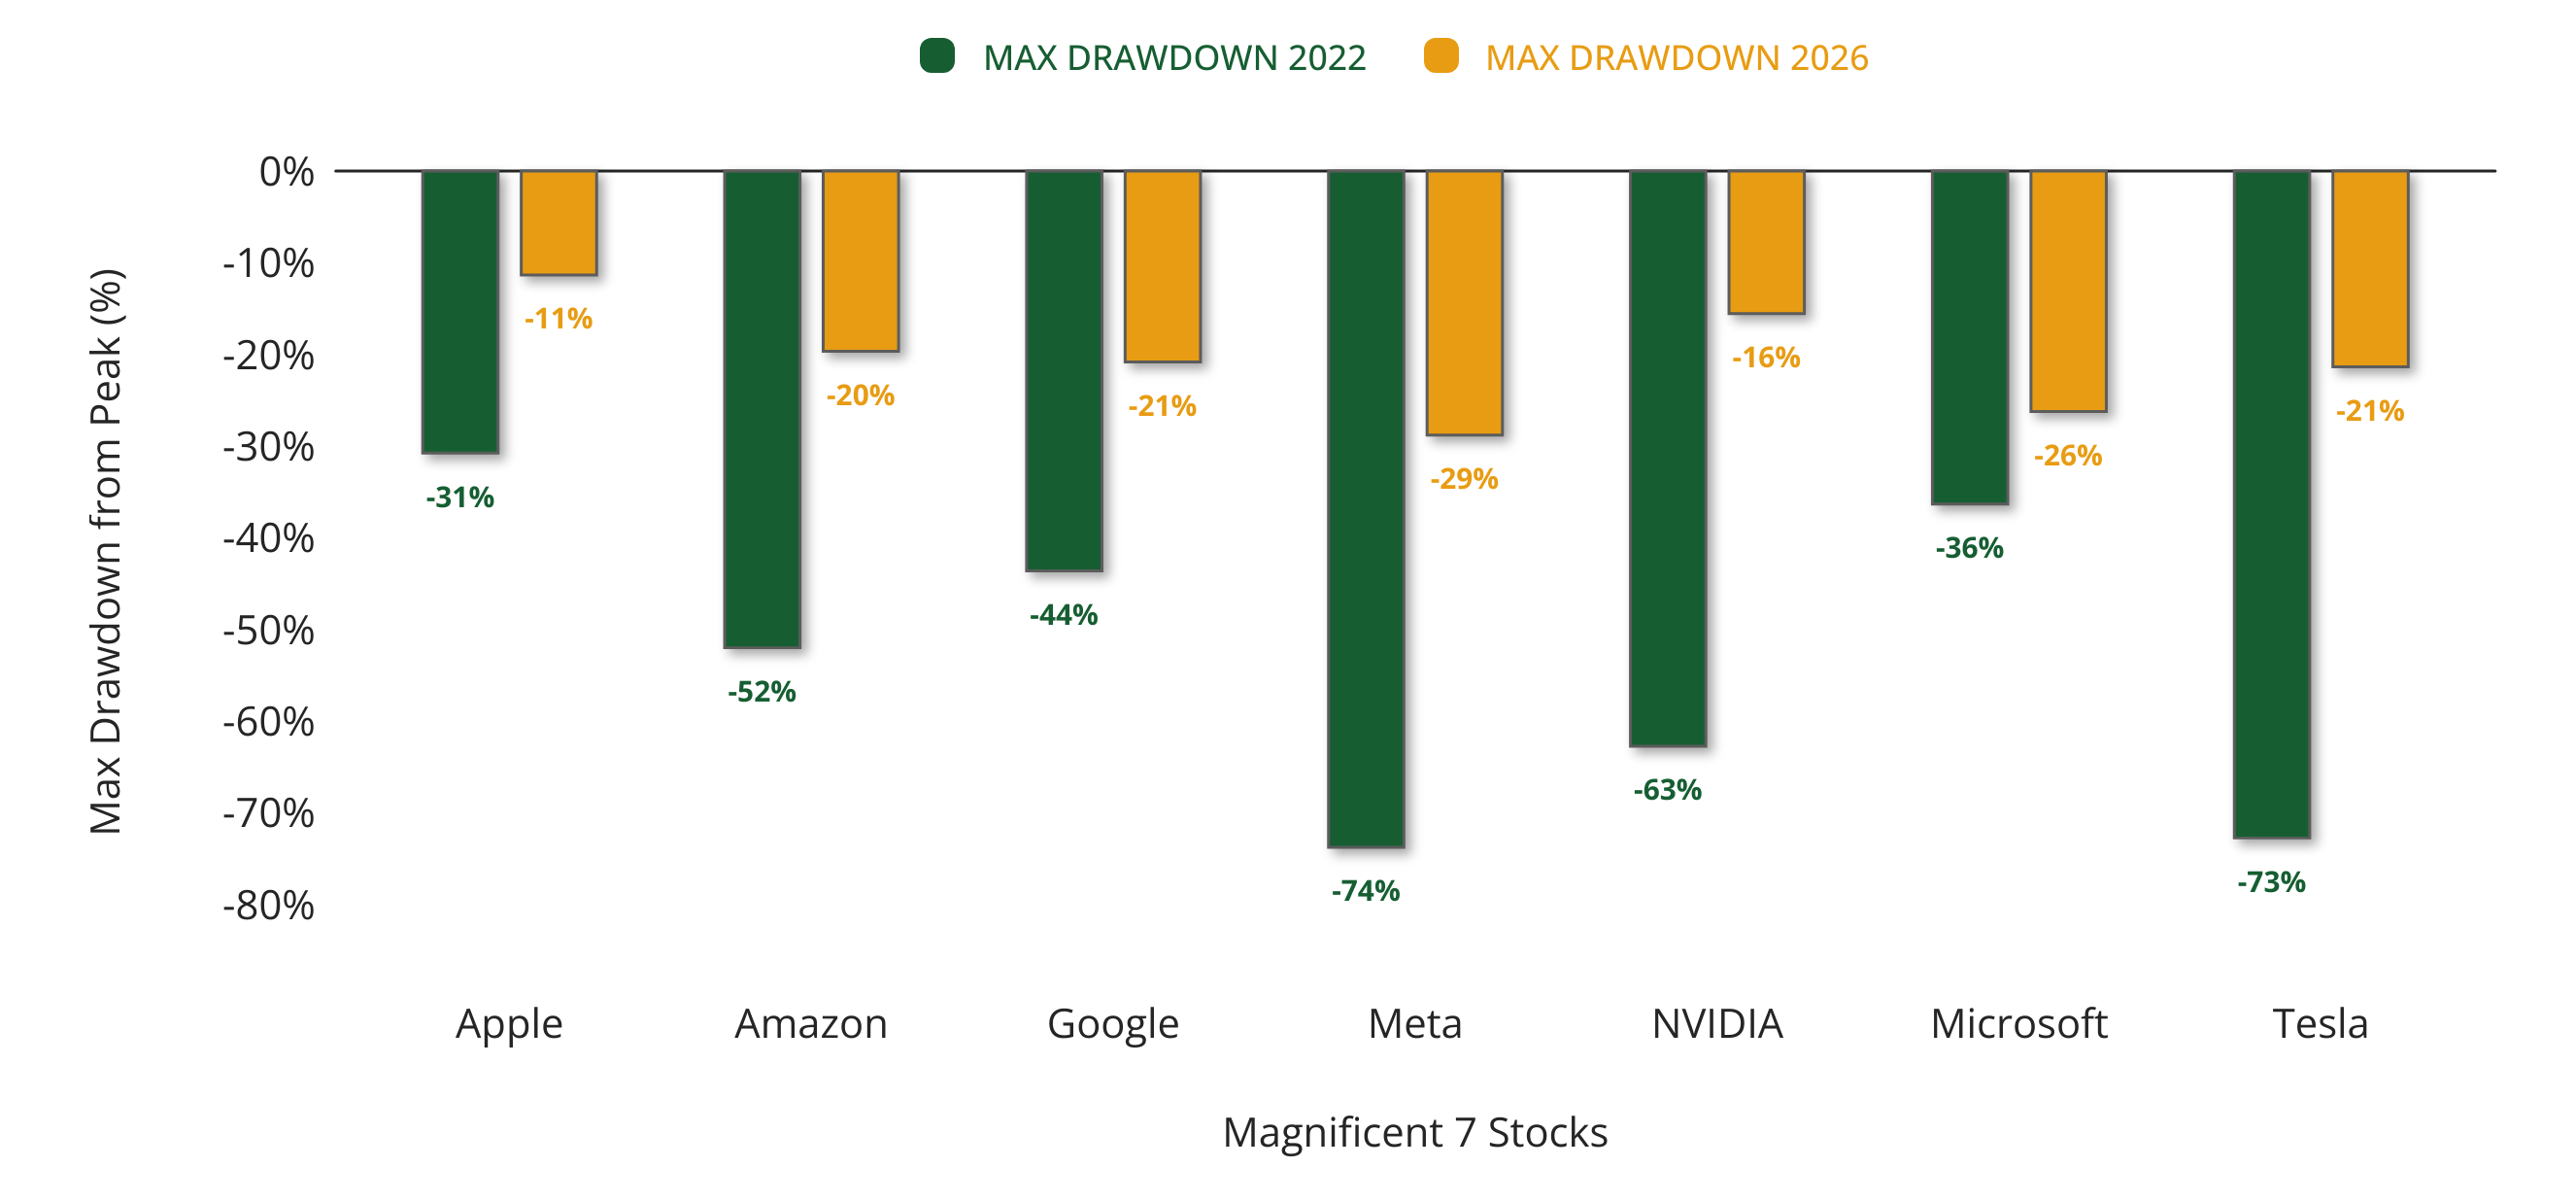
CHART FOUR: Source: © Exhibit A, FactSet Research Systems Inc., Standard & Poor's | Latest: 2026-04-01
There’s also a fascinating dynamic unfolding beneath the surface of the U.S. stock market that’s worth your attention. For the past several years, returns have been heavily concentrated in a handful of mega-cap technology companies, the so-called “Magnificent 7.” That concentration has started to crack. Chart 4 shows just how volatile these names have become this year. Amazon and Microsoft have each endured their own mini bear markets, and every other Mag 7 stock has been down at least 10% at some point. Meanwhile, the broader large-cap market has been considerably more resilient, a quiet but important shift in market leadership.
S&P 500 vs S&P 493 vs Mag7 in 2026
Year-to-date (YTD) Price Path of the S&P 500, S&P 493, and the Mag7
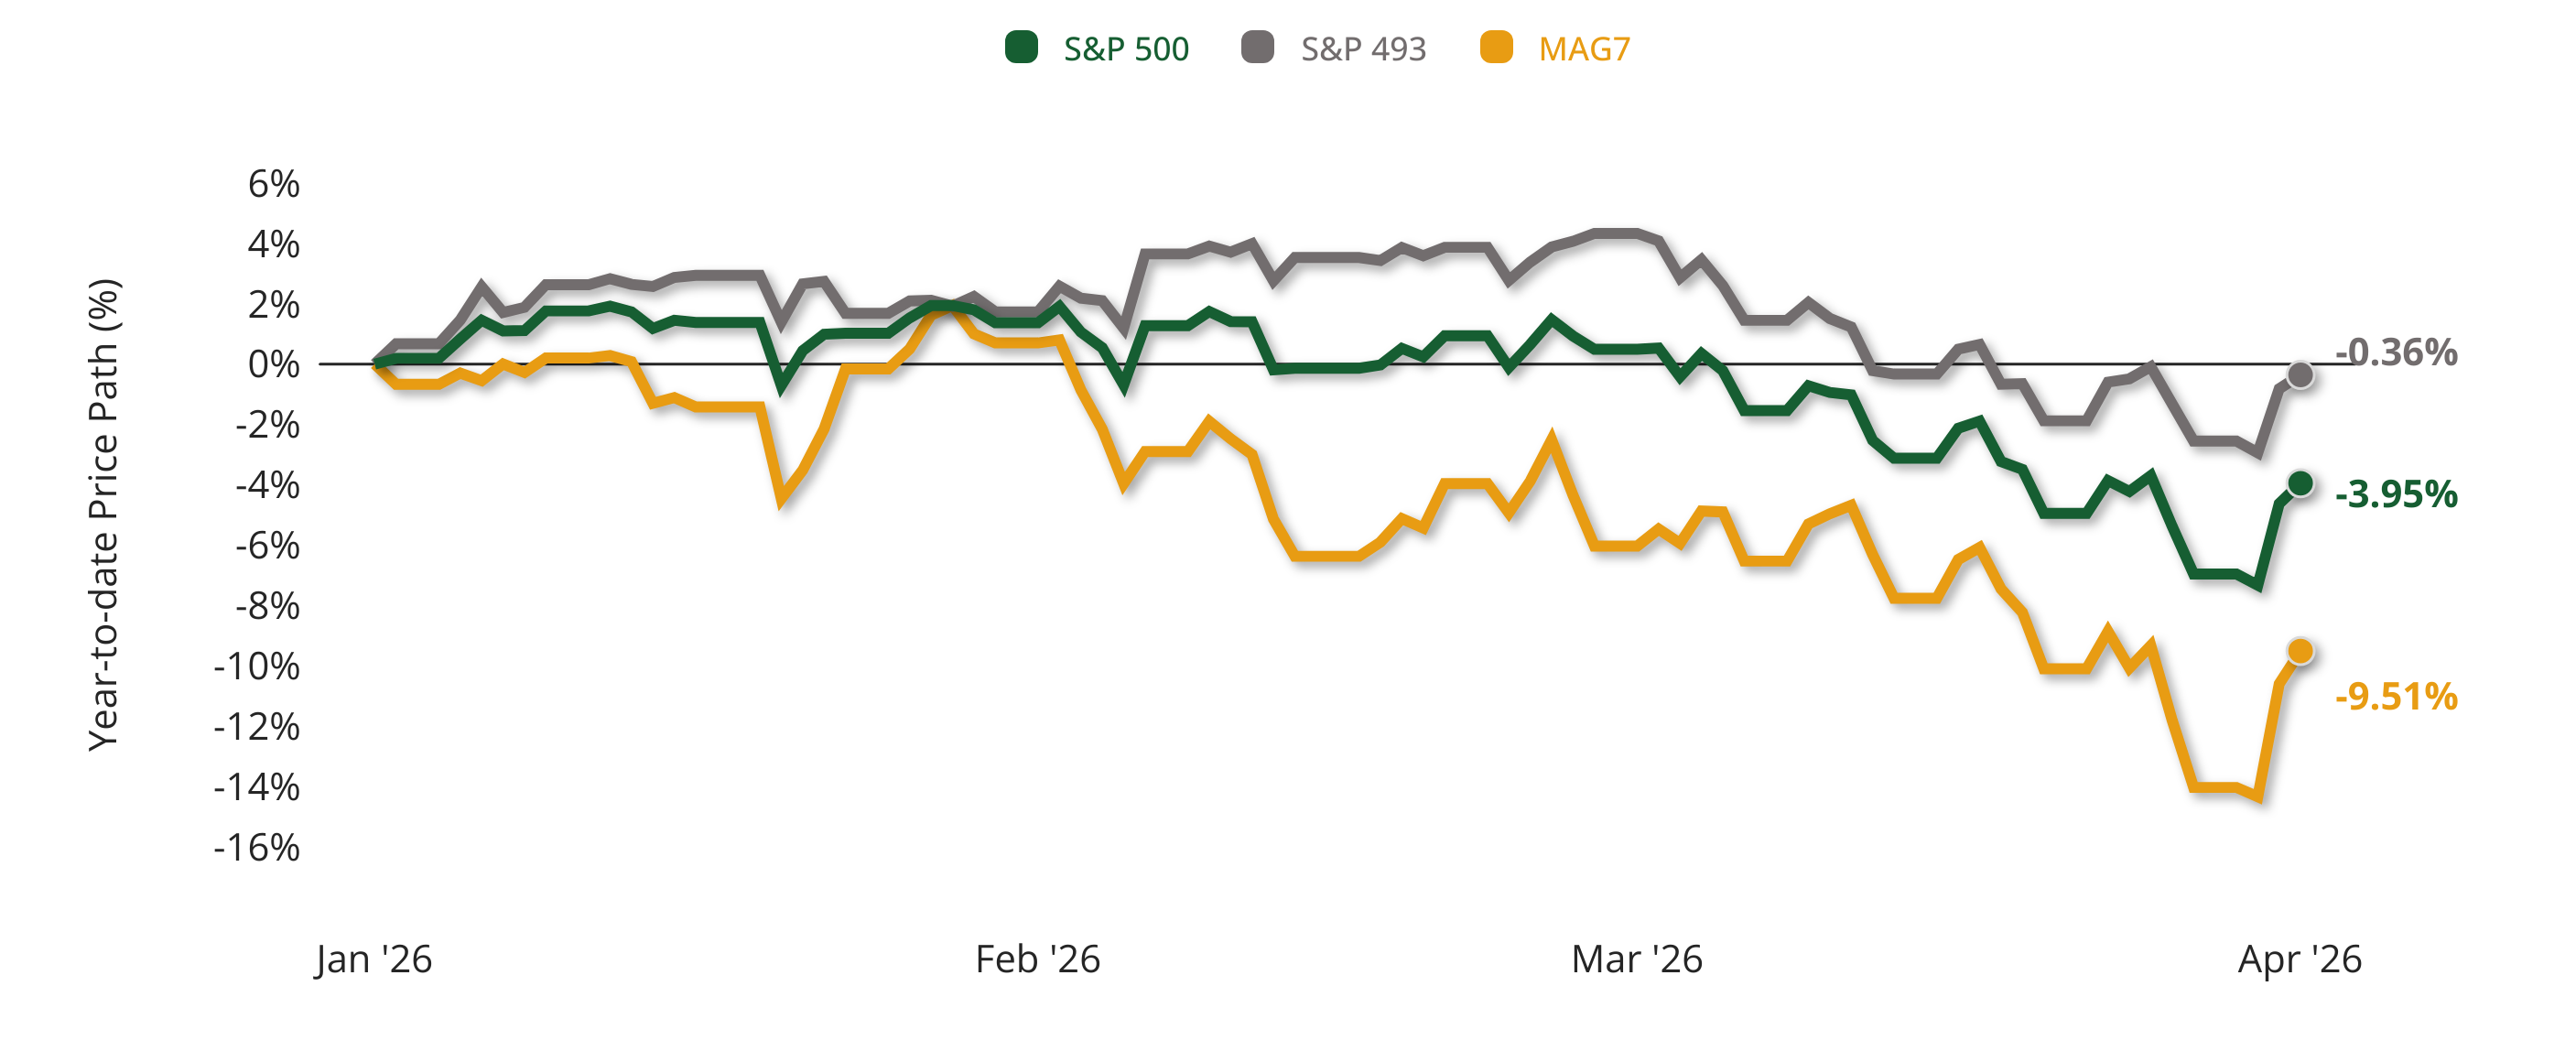
CHART FIVE: Source: © Exhibit A, FactSet Research Systems Inc., Standard & Poor's | Latest: 2026-04-01
Chart 5 puts a finer point on it. The Magnificent 7 are down nearly 9.5% so far in 2026, while the other 493 stocks in the S&P 500 are roughly flat. For years, the argument for owning everything equally rather than chasing the hottest names felt like leaving money on the table. Today, it looks like prudent risk management. That’s the essence of diversification: accepting good outcomes while missing out on great ones, but reducing the risk of catastrophic losses.
Markets are noisy right now. The geopolitical landscape is unsettled, oil prices are elevated, and the Fed’s path forward is less certain than it was just a few months ago. It is entirely understandable to feel uneasy. But if there’s one thread that runs through every chart in this newsletter, it’s this: the economy is more powerful than any single event, and a well-diversified portfolio is more powerful than any short-term storm. History has repeatedly handed us that lesson, and we’d be wise to receive it with humility and patience.
We know that times like these can raise questions about your portfolio, your timeline, and your peace of mind. That’s exactly what we’re here for. If you’d like to talk through how current events are affecting your specific situation or simply want reassurance that your plan is still on track, please don’t hesitate to reach out. Your brighter financial future is still the destination, and we’re here to help you stay the course to get there.
The opinions voiced in this material are for general information only and are not intended to provide specific advice or recommendations for any individual. To determine which investment(s) may be appropriate for you, consult your financial advisor before investing. All performance referenced is historical and is no guarantee of future results. Market conditions are subject to change, and indices are unmanaged and cannot be invested into directly.
The Standard & Poor’s 500 Index is a capitalization-weighted index of 500 stocks designed to measure the performance of the broad domestic economy through changes in the aggregate market value of 500 stocks representing all major industries.
No strategy assures success or protects against loss. The economic forecasts set forth in this newsletter may not develop as predicted, and there can be no guarantee that strategies promoted will be successful. There is no guarantee that a diversified portfolio will enhance overall returns or outperform a non-diversified portfolio. Diversification does not protect against market risk.
KWB Wealth is an SEC registered investment adviser. This material is solely for informational purposes. Advisory services are only offered to clients or prospective clients where KWB and its representatives are properly licensed or exempt from licensure. Past performance is no guarantee of future returns. Investing involves risk and possible loss of principal capital. No advice may be rendered by KWB unless a client service agreement is in place.