One of my favorite movies as a kid was Ace Ventura: Pet Detective. When I was 12, I could almost recite the entire movie from memory. If you haven’t seen it, in the film, Ace Ventura is investigating the disappearance of the Miami Dolphins mascot, a dolphin named Snowflake. At a certain point in the movie, Ace goes to the Dolphins’ stadium to examine Snowflake’s tank for clues. As he climbs into the tank, he tells his liaison from the team (played by Courtney Cox before she was on Friends), “If I’m not back in five minutes … just wait longer.”
As a long-term investor, this quote always enters my mind during a market downturn: if the market hasn’t bounced back yet, wait longer. That’s why Chart 1 (below) is by far my favorite chart in investing.
Chart 1 (below) shows that the longer you hold U.S. stocks, the more likely you will see new all-time highs. If you have a twenty-year time horizon, the S&P 500 hasn’t been negative since 1950. My favorite thing about Chart 1 is that on a daily basis, it’s a coin flip if the market is positive. However, compounding that 1% difference over longer and longer timeframes becomes a snowball rolling downhill.
Nevertheless, there must be the opposite side of long-term investing for all the good that comes with waiting: the ugly side. So, how likely will you experience a bear market (a negative 20% drop in stocks) the longer you hold stocks?
Historically, Odds of Gains Increase with Holding Period
How Often S&P 500 Was Higher Over Various Holding Periods
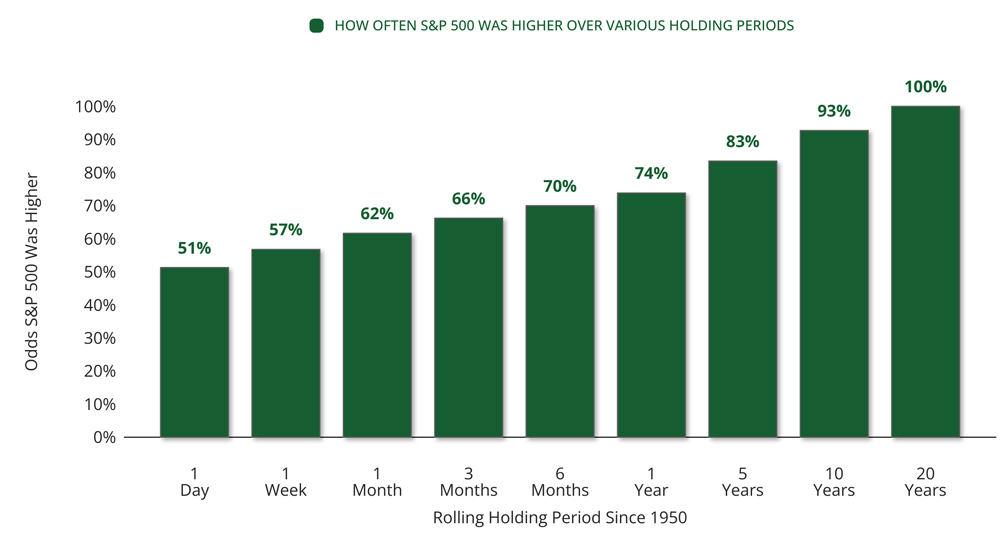
CHART ONE: Sources – Exhibit A, FactSet Research Systems Inc., Standard & Poor’s
Odds of Experiencing a Bear Market Increase by Holding Period
Historical Odds Of Experiencing a 20% Bear Market in the S&P 500 by Different Forward Holding Periods
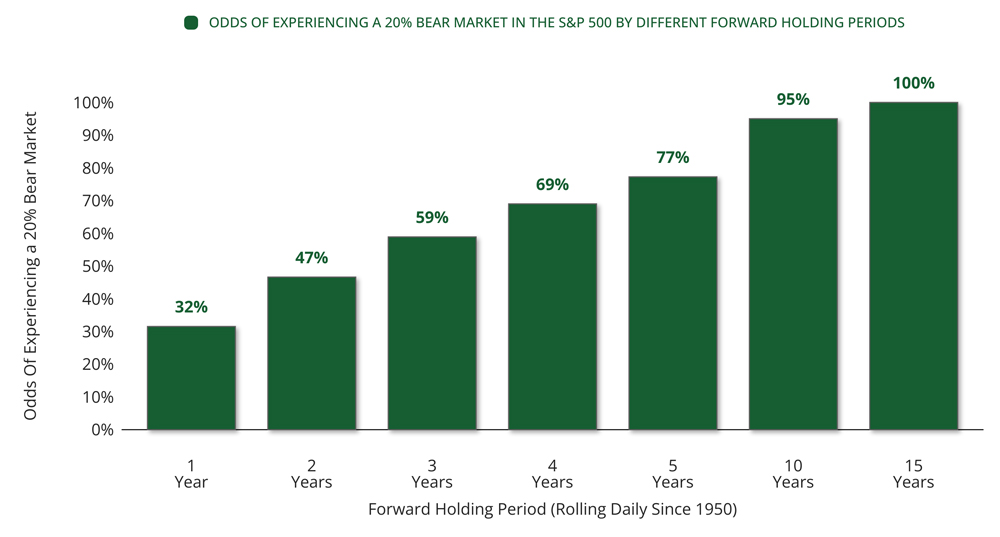
CHART TWO: Sources – Exhibit A, FactSet Research Systems Inc., Standard & Poor’s
Chart 2 shows that there is about a one-in-three chance that you will experience a bear market in any given year, and the longer you invest, the higher your chances of enduring a bear market. So, why do we subject ourselves to the stock market when we know we’ll deal with inevitable declines? Why not keep our money under the mattress and avoid the stress that stock volatility inflicts on us? There are two reasons: inflation and compounding.
There is an Opportunity Cost to Not Investing
Hypothetical growth of $100 (after inflation) under the mattress vs in the S&P 500
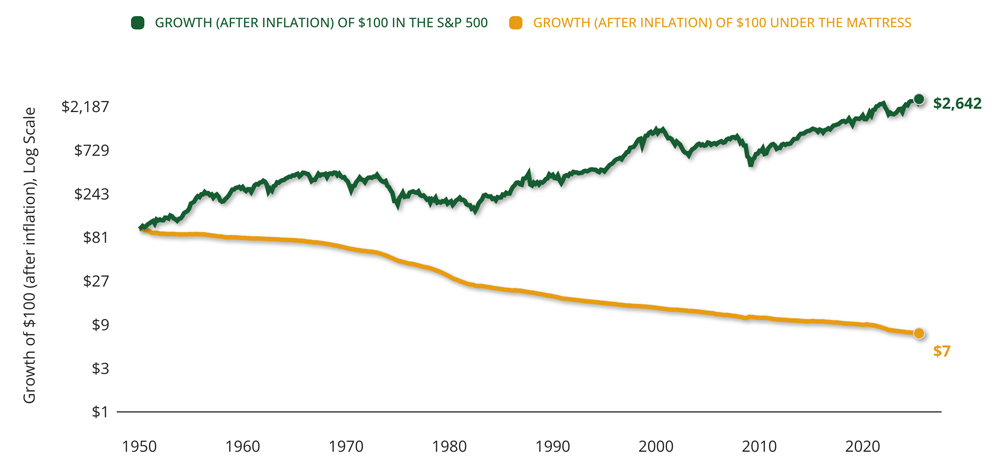
CHART THREE: Sources – Exhibit A, FactSet Research Systems Inc., Standard & Poor’s
Chart 3 shows the opportunity cost of investing versus not investing. Every year your money is not invested, it goes down in value due to the relentless curse of inflation. Juxtapose that with the green mountain chart showing how your money grows when invested in stocks, even after your return is adjusted for inflation. As you can see, it’s a much bumpier ride that gives you considerably more money than when you started. Lastly, I want to show you the power of compounding and why long-term investing is one of the few ways to accumulate wealth.
Gains Increase with Holding Period
Average S&P 500 Returns Over Various Holding Periods
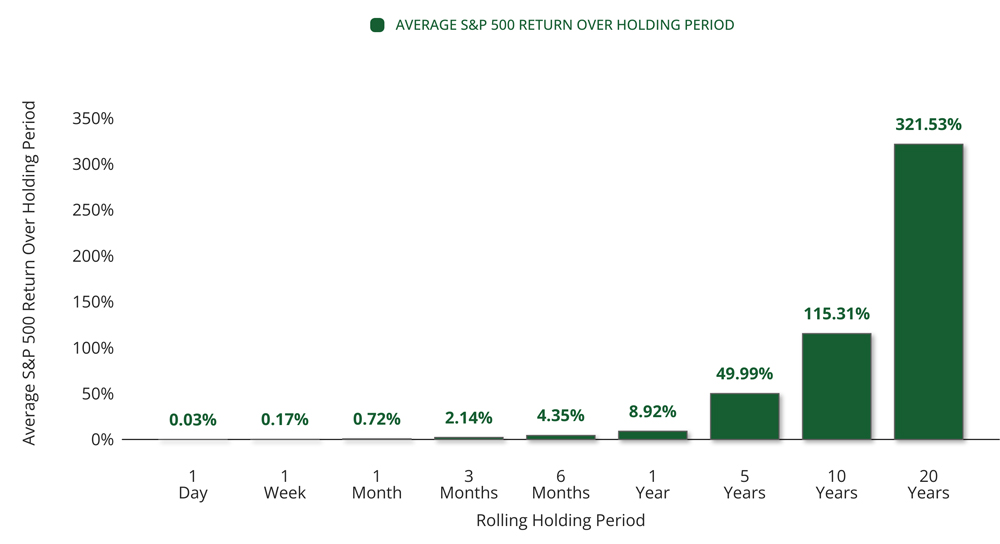
CHART FOUR: Sources – Exhibit A, FactSet Research Systems Inc., Standard & Poor’s
Chart 4 is my second favorite chart in investing. Can you believe that the average day is up just 0.03%? Imagine a world where the S&P 500 slowly and steadily rose by 0.03% daily instead of fluctuating up and down by a percent. Technically, that has happened since 1950 - a slow and steady grind higher, leading to an average of 321.5% gain over twenty years.
While long-term investing isn’t the easiest path, it is the most proven path to building wealth. For the retirees reading this, it’s important to remember that the longer you live, the longer you will continue to live. According to J.P. Morgan’s Guide to Retirement, a 65-year-old woman has a 52% chance of living to 85, and a 65-year-old man has a 39% chance. Even a new retiree has to plan for a 20-year retirement at the very least. Speaking of planning, if your goal is to leave money to your heirs, that time horizon extends past your own and down to their lives. That’s why it’s so important to speak with our wealth managers to discuss the time horizon for your investments and plan today for your brighter tomorrow.
Market Update
What a difference a quarter makes! In the last newsletter, I wrote about the market being on the verge of a bear market, and here we are, a slim percent away from all-time highs. This proves that focusing on the short term is not the mindset to have when investing. I have a quote from Morgan Housel written on the blackboard in my office that reads, “Consistency beats intelligence, if only because it takes emotion out of the equation.”
The stock market can make you so emotional in short bursts, but if you can show humility and stay consistent in emotionally charged times, you will beat 95% of investors over time.
I won’t bore you with any more charts. Just know that the market’s rise over the past couple of months has been quite impressive. If you are interested in seeing some of the bright spots we saw coming off of the stock market bottom, I point you to the most recent Study Time we hosted: youtube.com/@kwbwealth6957
Please get in touch with our office if you have any questions or if your financial situation has changed (beneficiaries, income needs, investment objectives, time horizon, risk tolerance, etc.). Thank you for your continued trust in KWB Wealth.
The opinions voiced in this material are for general information only and are not intended to provide specific advice or recommendations for any individual. To determine which investment(s) may be appropriate for you, consult your financial advisor prior to investing. All performance referenced is historical and is no guarantee of future results. All indices are unmanaged and cannot be invested into directly.
The Standard & Poor’s 500 Index is a capitalization-weighted index of 500 stocks designed to measure the performance of the broad domestic economy through changes in the aggregate market value of 500 stocks representing all major industries.
No strategy assures success or protects against loss. The economic forecasts set forth in this newsletter may not develop as predicted, and there can be no guarantee that strategies promoted will be successful.
KWB Wealth is an SEC registered investment adviser. This material is solely for informational purposes. Advisory services are only offered to clients or prospective clients where KWB and its representatives are properly licensed or exempt from licensure. Past performance is no guarantee of future returns. Investing involves risk and possible loss of principal. No advice may be rendered by KWB unless a client service agreement is in place.
The advisers of KWB Wealth are registered with, and securities offered through LPL Financial, Member FINRA/SIPC. Investment advice offered through KWB Wealth, an SEC registered investment adviser and separate entity from LPL Financial.