
If 2025 felt like a year full of contradictions, you’re not alone.
At various points, markets faced what felt like a steady stream of concerns: trade tensions/tariff concerns flared up during springtime, the housing market never quite found its footing, questions lingered around employment, and the government experienced its longest shutdown in U.S. history. Taken together, these headlines didn’t exactly inspire confidence.
And yet, here we are with markets sitting near all-time highs.
This is a reminder that markets don’t wait for clarity. Historically, they’ve had a habit of climbing what’s known as the “wall of worry,” and 2025 was a textbook example. Investors were asked to decide whether they should react to headlines or remain focused on long-term plans.
A Year Where Diversification Paid Off
One of the most notable features of 2025 was how broad the gains were. Nearly every major asset class finished the year higher, and returns weren’t concentrated in just one corner of the market.
2025 Asset Class Returns
2025 year-to-date asset class price returns
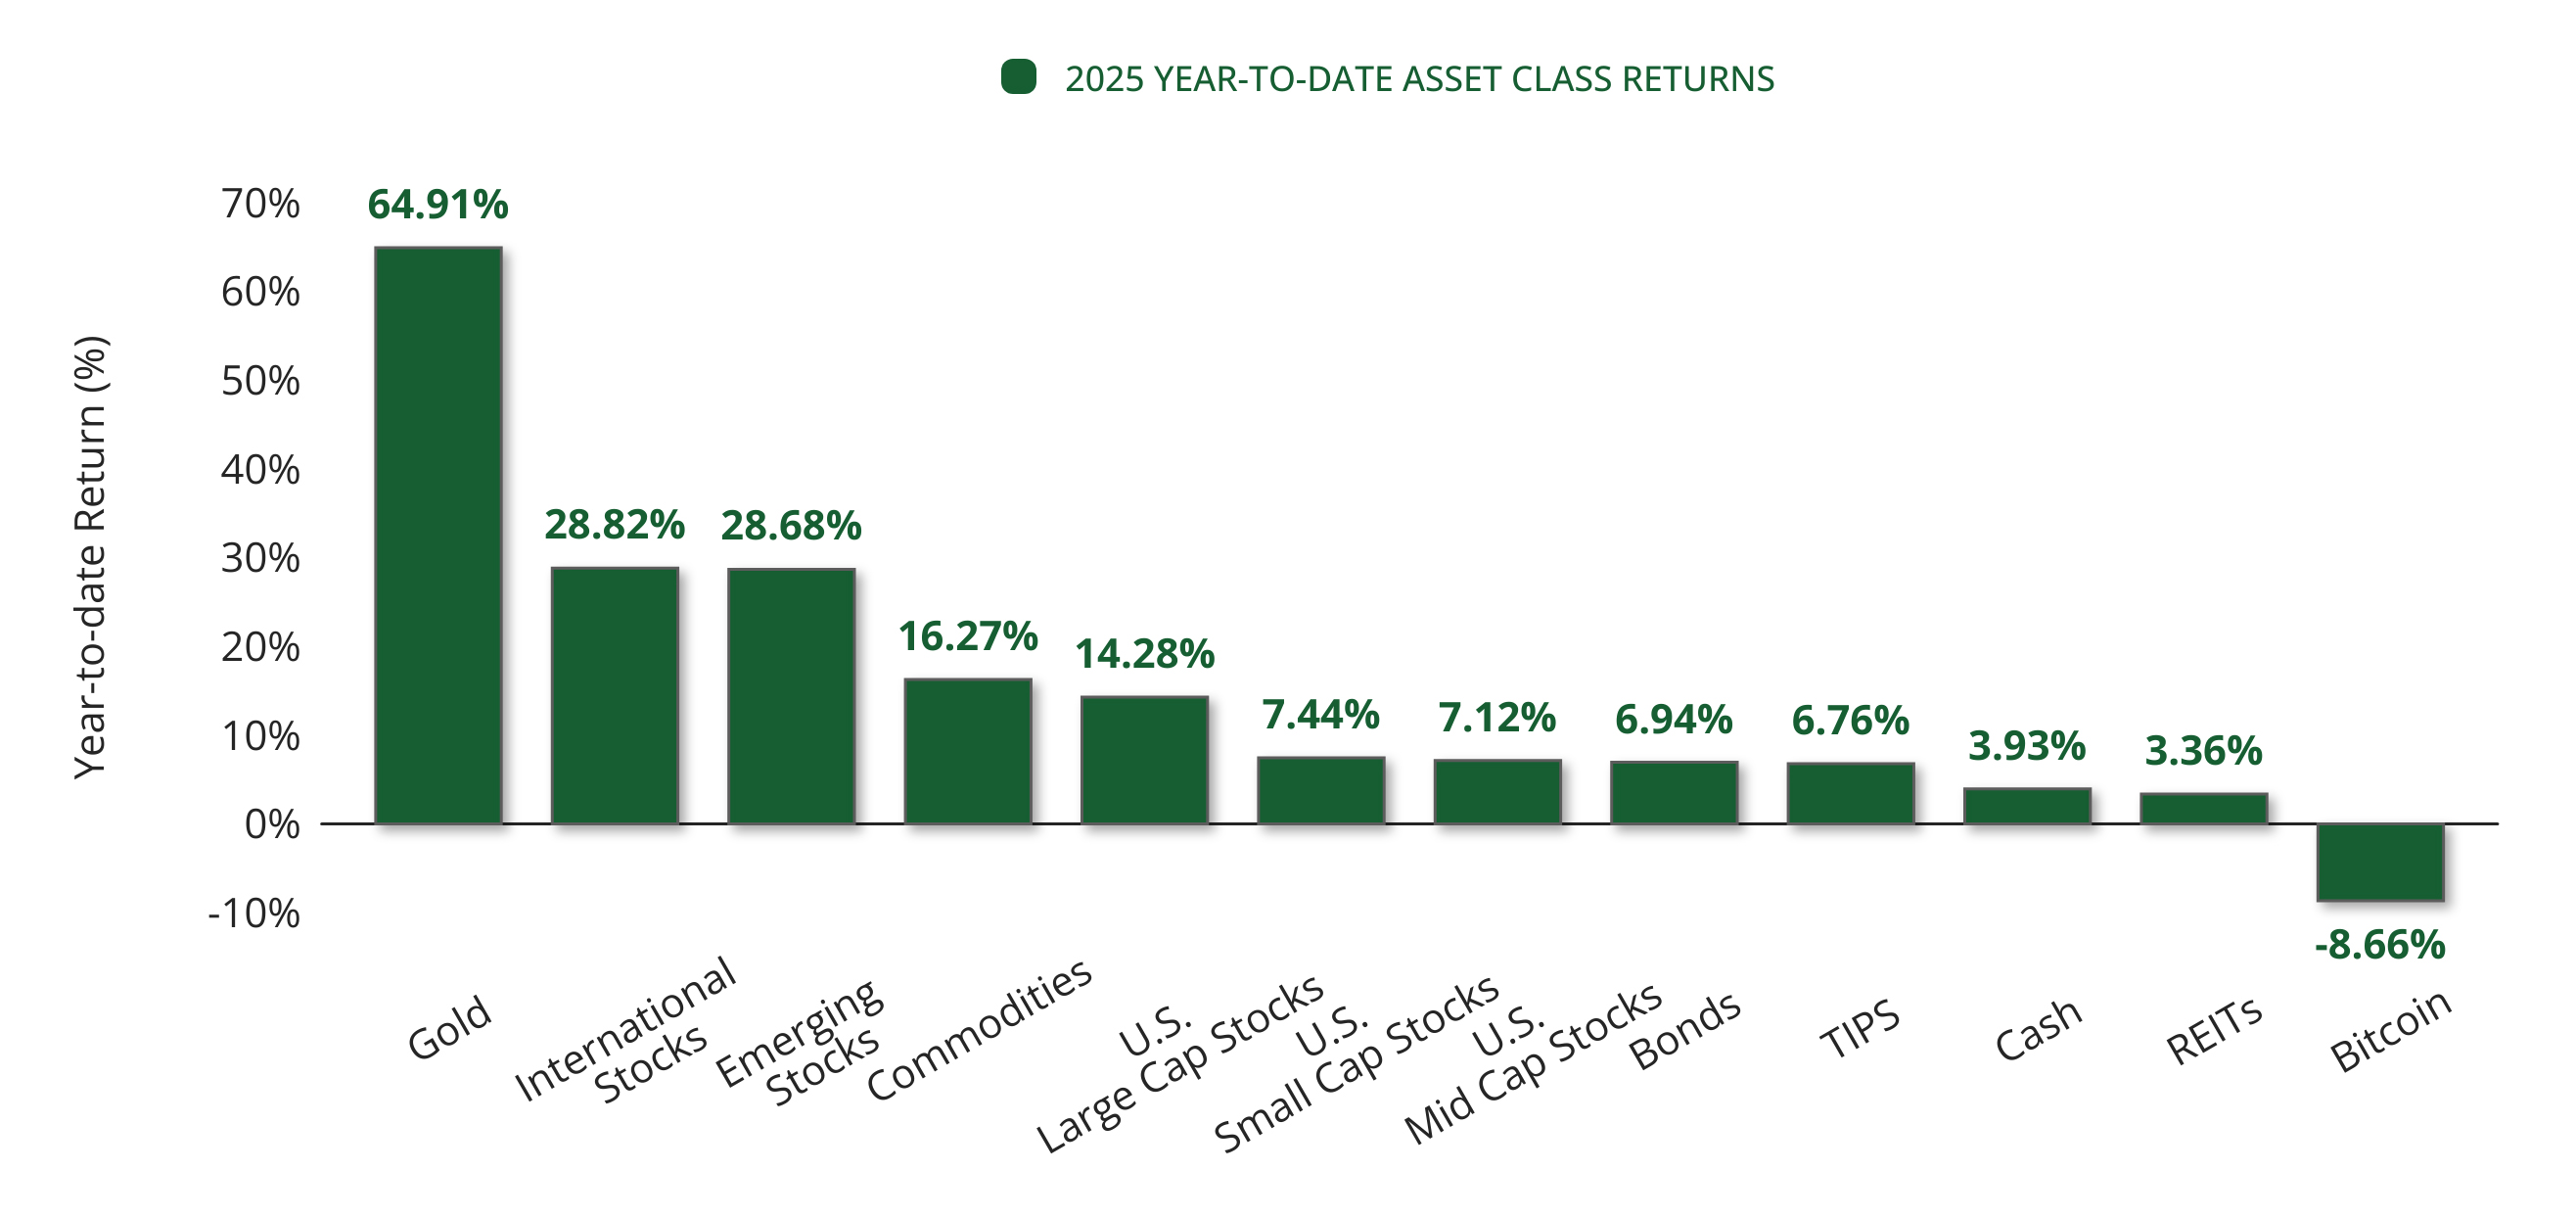
CHART ONE: Source: © Exhibit A, FactSet Research Systems Inc., Standard & Poor’s | Latest: 2025-12-17
Chart 1 illustrates this clearly. From U.S. stocks to international equities, commodities, and precious metals, returns were spread across asset classes rather than dominated by a single winner. Gold stood out as the top performer, supported by central banks’ increased reserves. International stocks, both developed and emerging markets, also had a strong year, helped by renewed fiscal and monetary stimulus abroad and a weakening U.S. dollar. Commodities and U.S. large-cap stocks rounded out a year that rewarded patience and balance.
This matters because diversification doesn’t always feel good in the moment. There are years when one index or one sector dominates the headlines, making everything else seem unnecessary. But 2025 reminded us why we’ve emphasized diversification since KWB Wealth was founded. Not to chase what’s hottest, but to manage risk, smooth the ride, and stay invested across different environments.
As investing author Ben Carlson once put it, “Diversification means accepting “good enough” while missing out on “great” but avoiding “terrible.” In 2025, diversification not only reduced risk but also improved results compared to owning the S&P 500 alone. That’s a welcome outcome, but more importantly, it reinforces a philosophy we’ve believed in for decades.
Our goal has never been to beat an index. It’s to help you reach your goals with confidence.
While stocks tend to grab the headlines, 2025 was also a reminder that a well-constructed portfolio isn’t just about equities.
Higher interest rates have made bonds and cash more relevant than they’ve been in years. Income has once again become a meaningful contributor to total return, and fixed income has resumed its role as both a stabilizer and a source of opportunity within diversified portfolios.
As we move into 2026, interest rates, inflation trends, and economic growth will continue to influence how we position across stocks, bonds, and cash. Rather than making big directional bets, we remain focused on balance and building portfolios that can adapt to evolving conditions.
About That "Bubble" Talk
We’ve heard the questions, especially around artificial intelligence and the group of mega-cap growth stocks that have powered much of the market’s momentum. Whenever innovation moves quickly, talk of bubbles isn’t far behind.
A true market bubble typically shows up when prices rise significantly faster than underlying business fundamentals and when investors are willing to pay exorbitant prices for the same level of earnings. That wasn’t the story in 2025.
Where Are Equity Returns Coming From In 2025?
S&P 500 YTD total return broken down by contribution from earnings, P/E multiple, and dividends
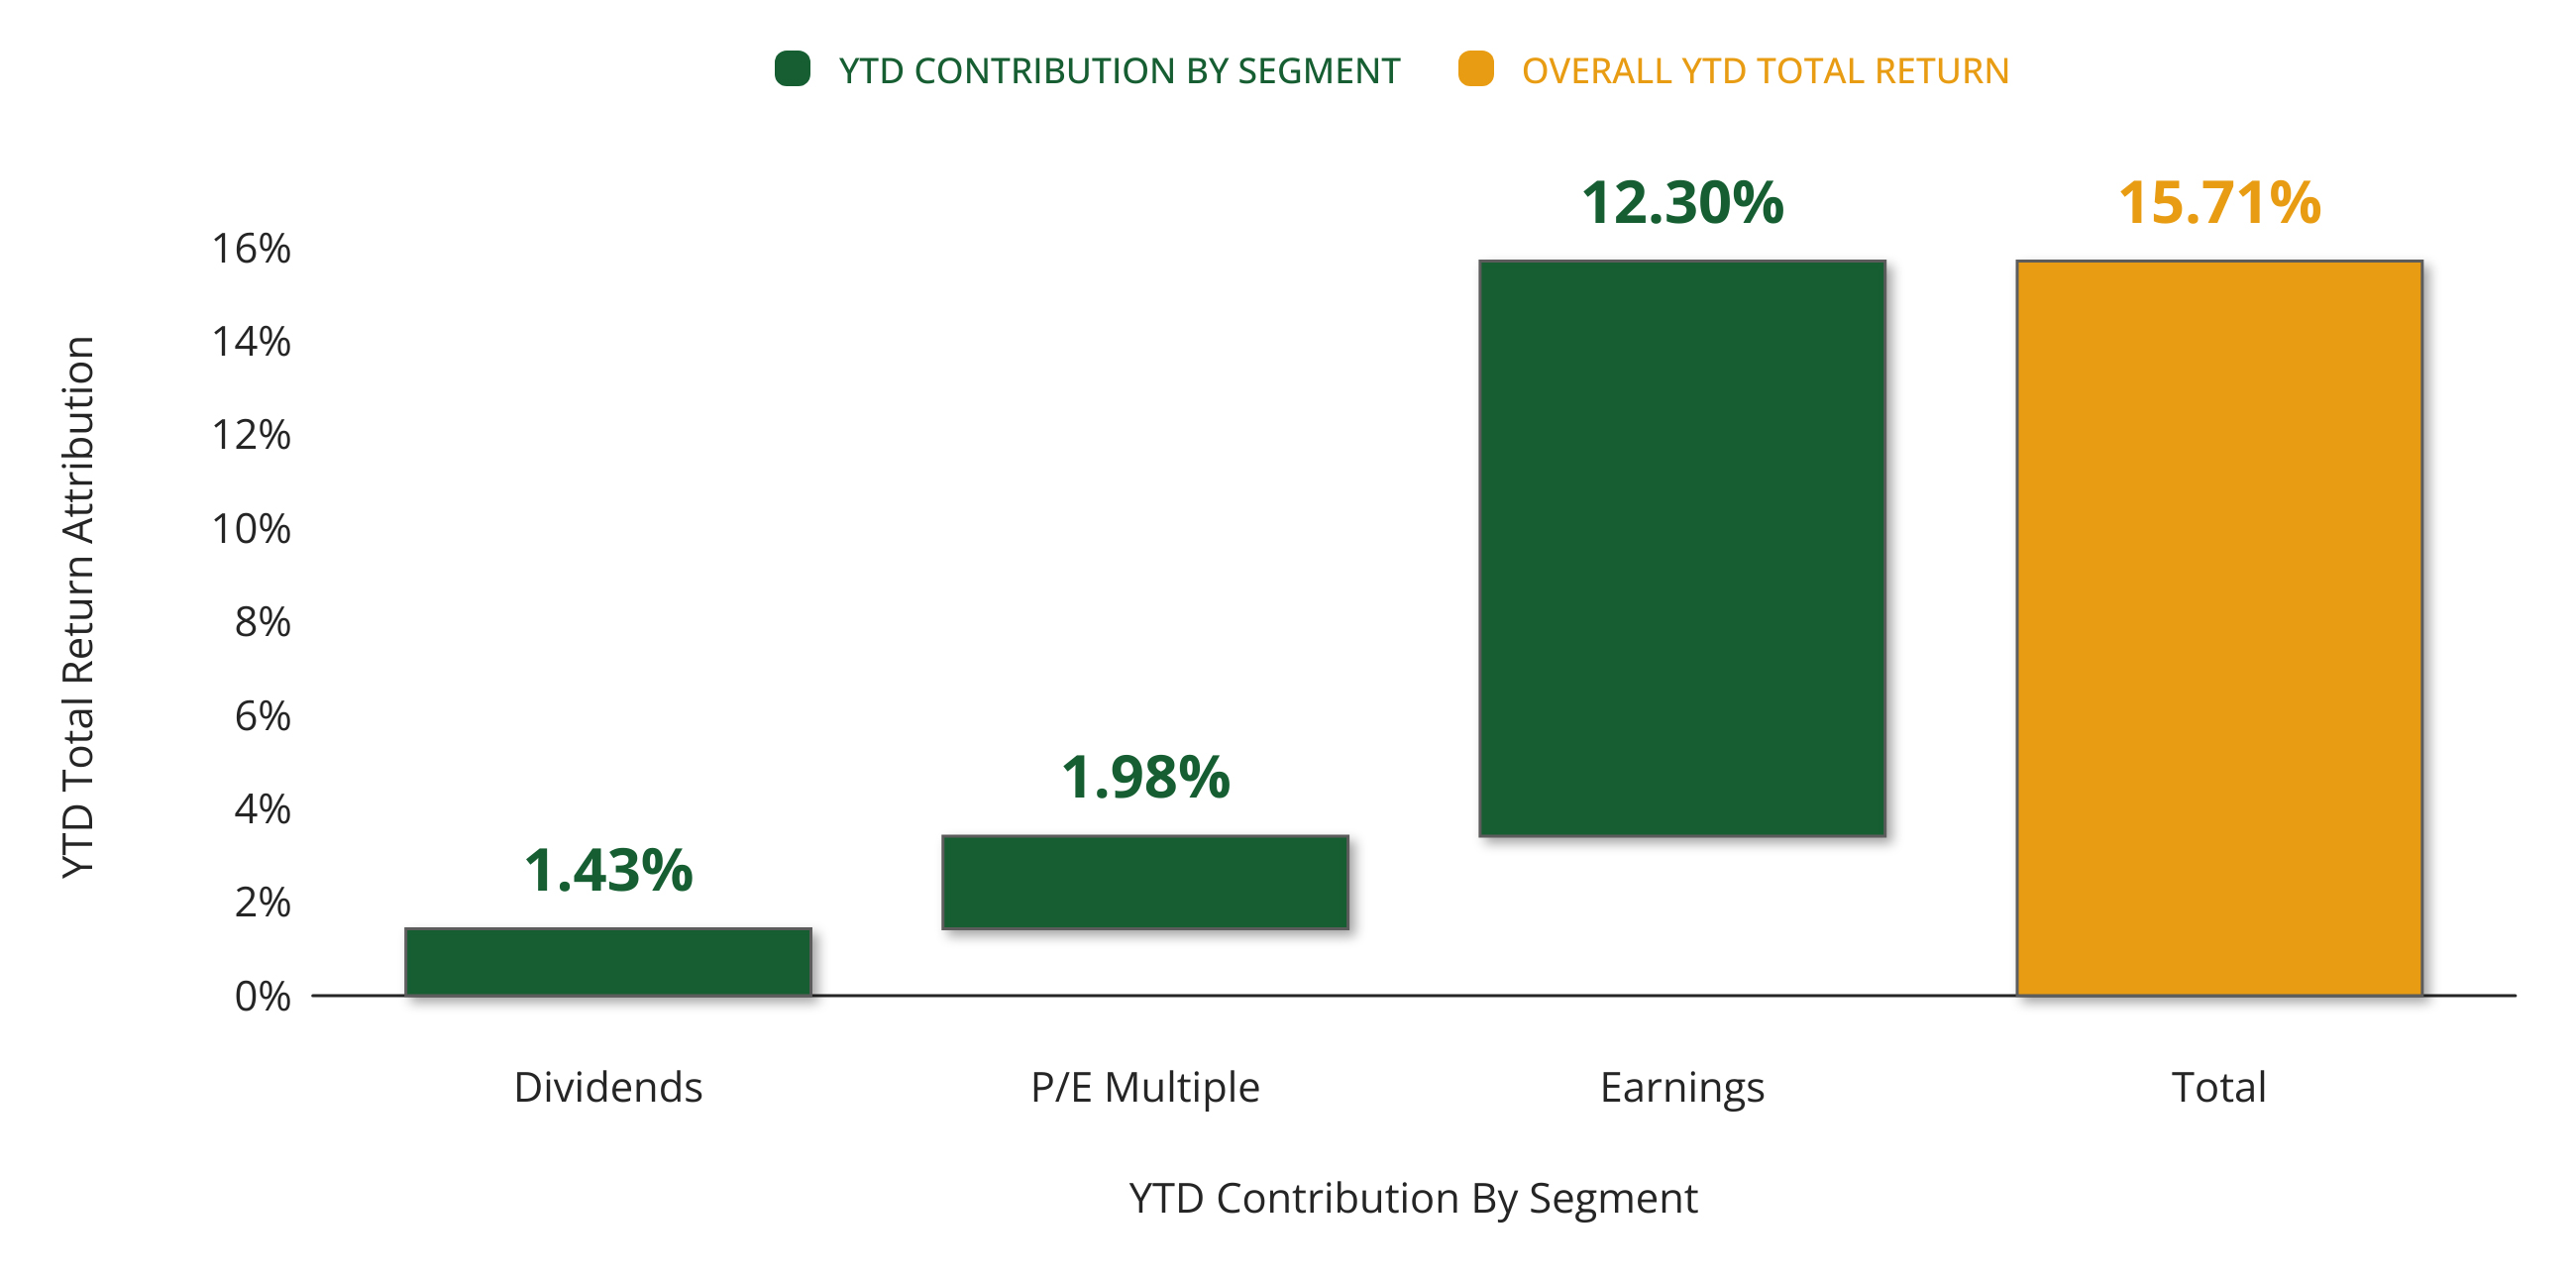
CHART TWO: Source: © Exhibit A, FactSet Research Systems Inc., Standard & Poor’s | Latest: 2025-12-17
As shown in Chart 2, the majority of stock market returns this year came from earnings growth rather than investors paying dramatically higher prices for stocks. There was some modest valuation expansion but nothing resembling the excesses that typically define a bubble.
That distinction is essential. It suggests that markets were responding to improving business fundamentals, rather than speculation alone. If this were a bubble, it would be a historically small one, and history tells us that bubbles tend to look obvious in hindsight, not subtle in real-time.
Looking Ahead to 2026
As we turn the page to 2026, expectations remain constructive. Corporate earnings are projected to continue growing at a healthy pace, providing a solid foundation for the stock market.
Sources of Earnings Growth and Profit Margins
S&P 500 EPS growth, Year-over-year growth broken into changes in revenue, profit margin and share count
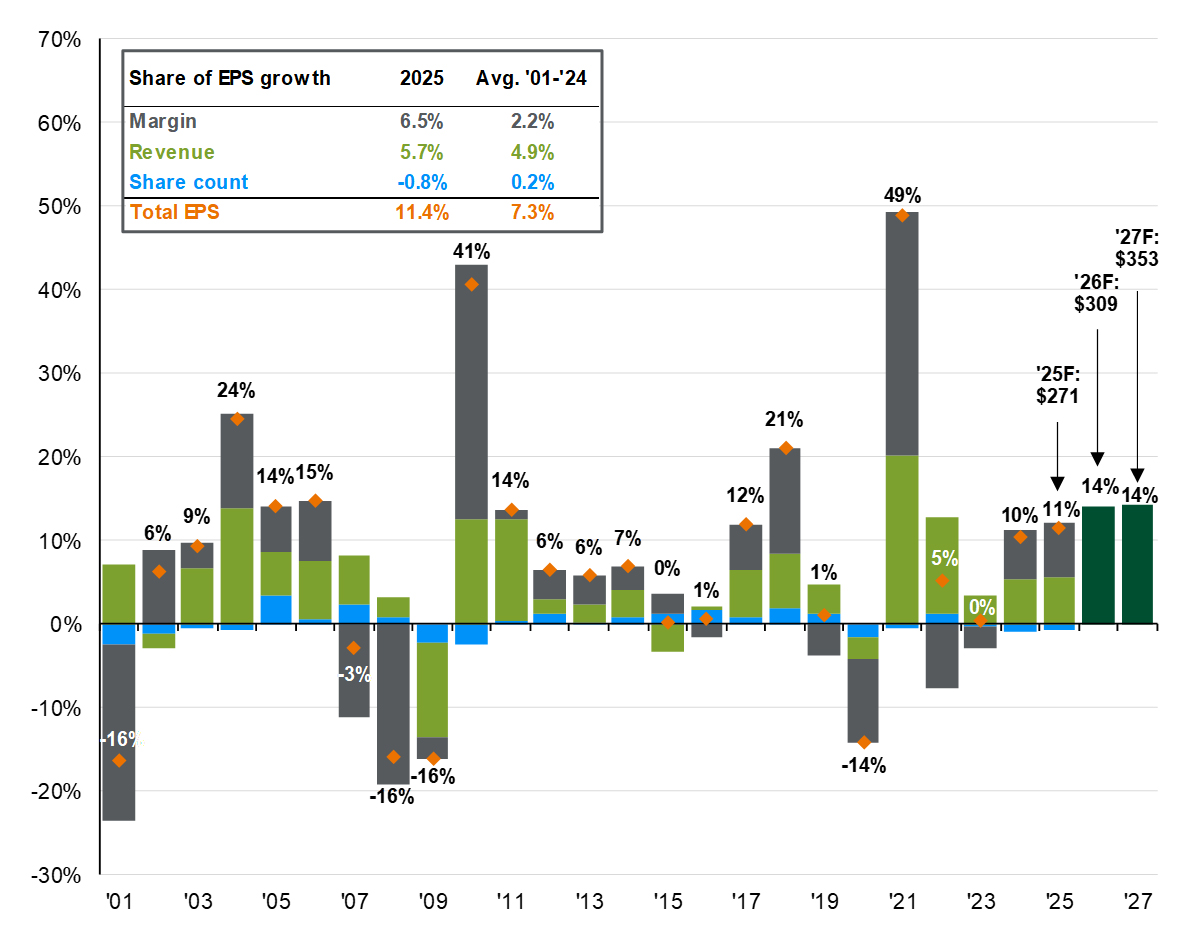
CHART THREE: Source: Compustat, FactSet, Standard & Poor’s, J.P. Morgan Asset Management. Historical EPS values are based on annual earnings per share. Forecasts for 2025, 2026 and 2027 reflect consensus analyst expectations, provided by FactSet. Past performance is no guarantee of future results. Guide to the Markets - U.S. Data are as of November 28, 2025.
Chart 3 highlights this outlook, showing S&P 500 earnings expected to grow meaningfully in both 2026 and 2027. If those expectations are met, earnings growth, rather than speculation, will continue to be the primary driver of returns.
That said, strong markets rarely move in a straight line.
Midterm Years See The Largest Intra-Year Pullback
Pullbacks and returns a year off the lows for the S&P 500 Index based on the four-year presidential cycle
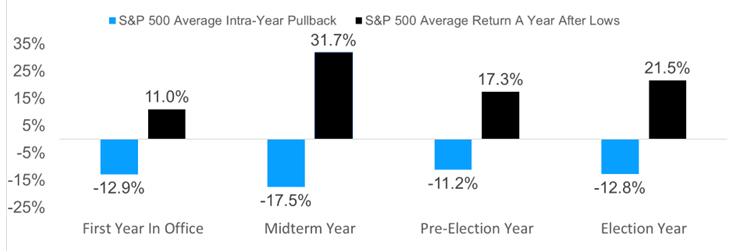
CHART FOUR: Source: Carson Investment Research, Factset 11/16/2025 (1950 - 2024
Midterm election years have historically been the most volatile part of the political cycle. As shown in Chart 4, Year 2 of a presidential term often experiences the most significant pullbacks, but it has also been the setup for some of the strongest rallies that follow. Markets tend to struggle with uncertainty until they gain confidence once the political landscape becomes clearer.
Under Second Term Presidents, Stocks Do Better Early
PS&P 500 performance based on the four-year presidential cycle (1950 - 2024)
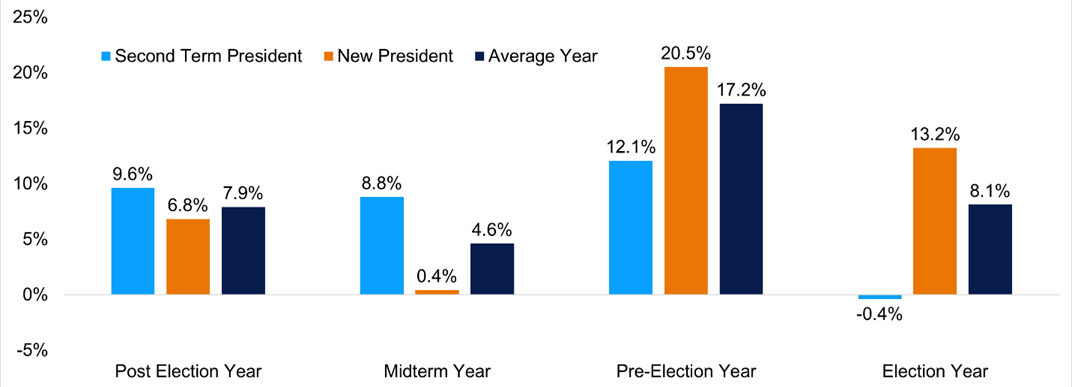
CHART FIVE: Source: Carson Investment Research, YCharts 01/23/2025
An interesting wrinkle in this cycle is that, while President Trump is beginning a non-consecutive second term, history suggests second-term presidencies have tended to experience better midterm-year market outcomes than first terms. Chart 5 illustrates this pattern, showing stronger average returns during midterm years under second-term presidents.
Of course, no two cycles are identical. But historical context helps us frame volatility for what it often is: uncomfortable in the short term but not necessarily a signal to abandon long-term discipline.
Staying Focused on What Matters Most
No matter what 2026 brings, our approach remains unchanged.
We will continue to emphasize diversification, patience, and discipline. Short-term market movements are unpredictable, but long-term progress is built by owning resilient businesses, maintaining appropriate risk exposure, and staying aligned with a thoughtful plan.
Periods of volatility can feel unsettling, especially when headlines are loud. But history has shown that reacting emotionally to short-term market moves often does more harm than good. Unless your personal circumstances change, we don’t believe volatility alone warrants dramatic shifts in strategy.
Your financial plan remains our guiding North Star, helping you make informed decisions, manage risk, and move toward the brighter future you’ve envisioned.
As always, the KWB Wealth team is here as a resource, a sounding board, and a partner. Thank you for the trust you place in us. We hope you enjoyed the holiday season, and we look forward to navigating 2026 together.
The opinions voiced in this material are for general information only and are not intended to provide specific advice or recommendations for any individual. To determine which investment(s) may be appropriate for you, consult your financial advisor before investing. All performance referenced is historical and is no guarantee of future results. Market conditions are subject to change, and indices are unmanaged and cannot be invested into directly.
KWB Wealth is an SEC registered investment adviser. This material is solely for informational purposes. Advisory services are only offered to clients or prospective clients where KWB and its representatives are properly licensed or exempt from licensure. Past performance is no guarantee of future returns. Investing involves risk and possible loss of principal capital. No advice may be rendered by KWB unless a client service agreement is in place.
The Standard & Poor’s 500 Index is a capitalization-weighted index of 500 stocks designed to measure the performance of the broad domestic economy through changes in the aggregate market value of 500 stocks representing all major industries. Indices are for illustrative purposes only and do not reflect the performance of any specific investment.
Investing involves risk, including loss of principal. Diversification and asset allocation strategies do not guarantee profits or protect against losses in declining markets.
International and emerging market investing involves special risks such as currency fluctuation and political instability and may not be suitable for all investors.
No strategy assures success or protects against loss. The economic and earnings forecasts set forth in this newsletter may not develop as predicted, and there can be no guarantee that strategies discussed will be successful.
Historical market behavior during political or election cycles is provided for context only and is not predictive of future market performance.
Chart Disclosures:
Charts and data included in this newsletter are derived from third-party sources believed to be reliable; however, their accuracy and completeness cannot be guaranteed. Index performance shown is for illustrative purposes only. Indices are unmanaged, do not reflect the deduction of advisory fees, transaction costs, or taxes, and cannot be invested into directly. Past performance is not indicative of future results.
Certain charts include forward-looking information, including earnings estimates and expectations, which are based on assumptions and current conditions and may not develop as predicted.
Charts showing currency or U.S. dollar movements are provided for informational purposes only and do not represent investable returns. Currency exposure involves risk, including exchange-rate fluctuations.